Making Sense
How did I make sense of the data collected and what did I learn?
Take some time to poke around and explore the data from each method in detail. You can find exciting insights on this page!
For broader conclusions and insights across methods head here >.


Exploration Worksheets
To make sense of the data from the Stage 2 sessions, I explored…What topics did groups choose?
What kinds of futures did participants imagine using this tool?
Analyzing the Exploration Worksheets looked like putting everything the participants wrote down into a quick spreadsheet. I had an inkling of this already, but in typing everything up it was obvious that everyone focused on what they wanted for the future. They chose to share their dreams, writing down almost exclusively positive ideas instead of sharing fears for the future. A primary goal in designing the sessions was to avoid biasing anyone toward utopian or dystopian futures so this was a surprise!
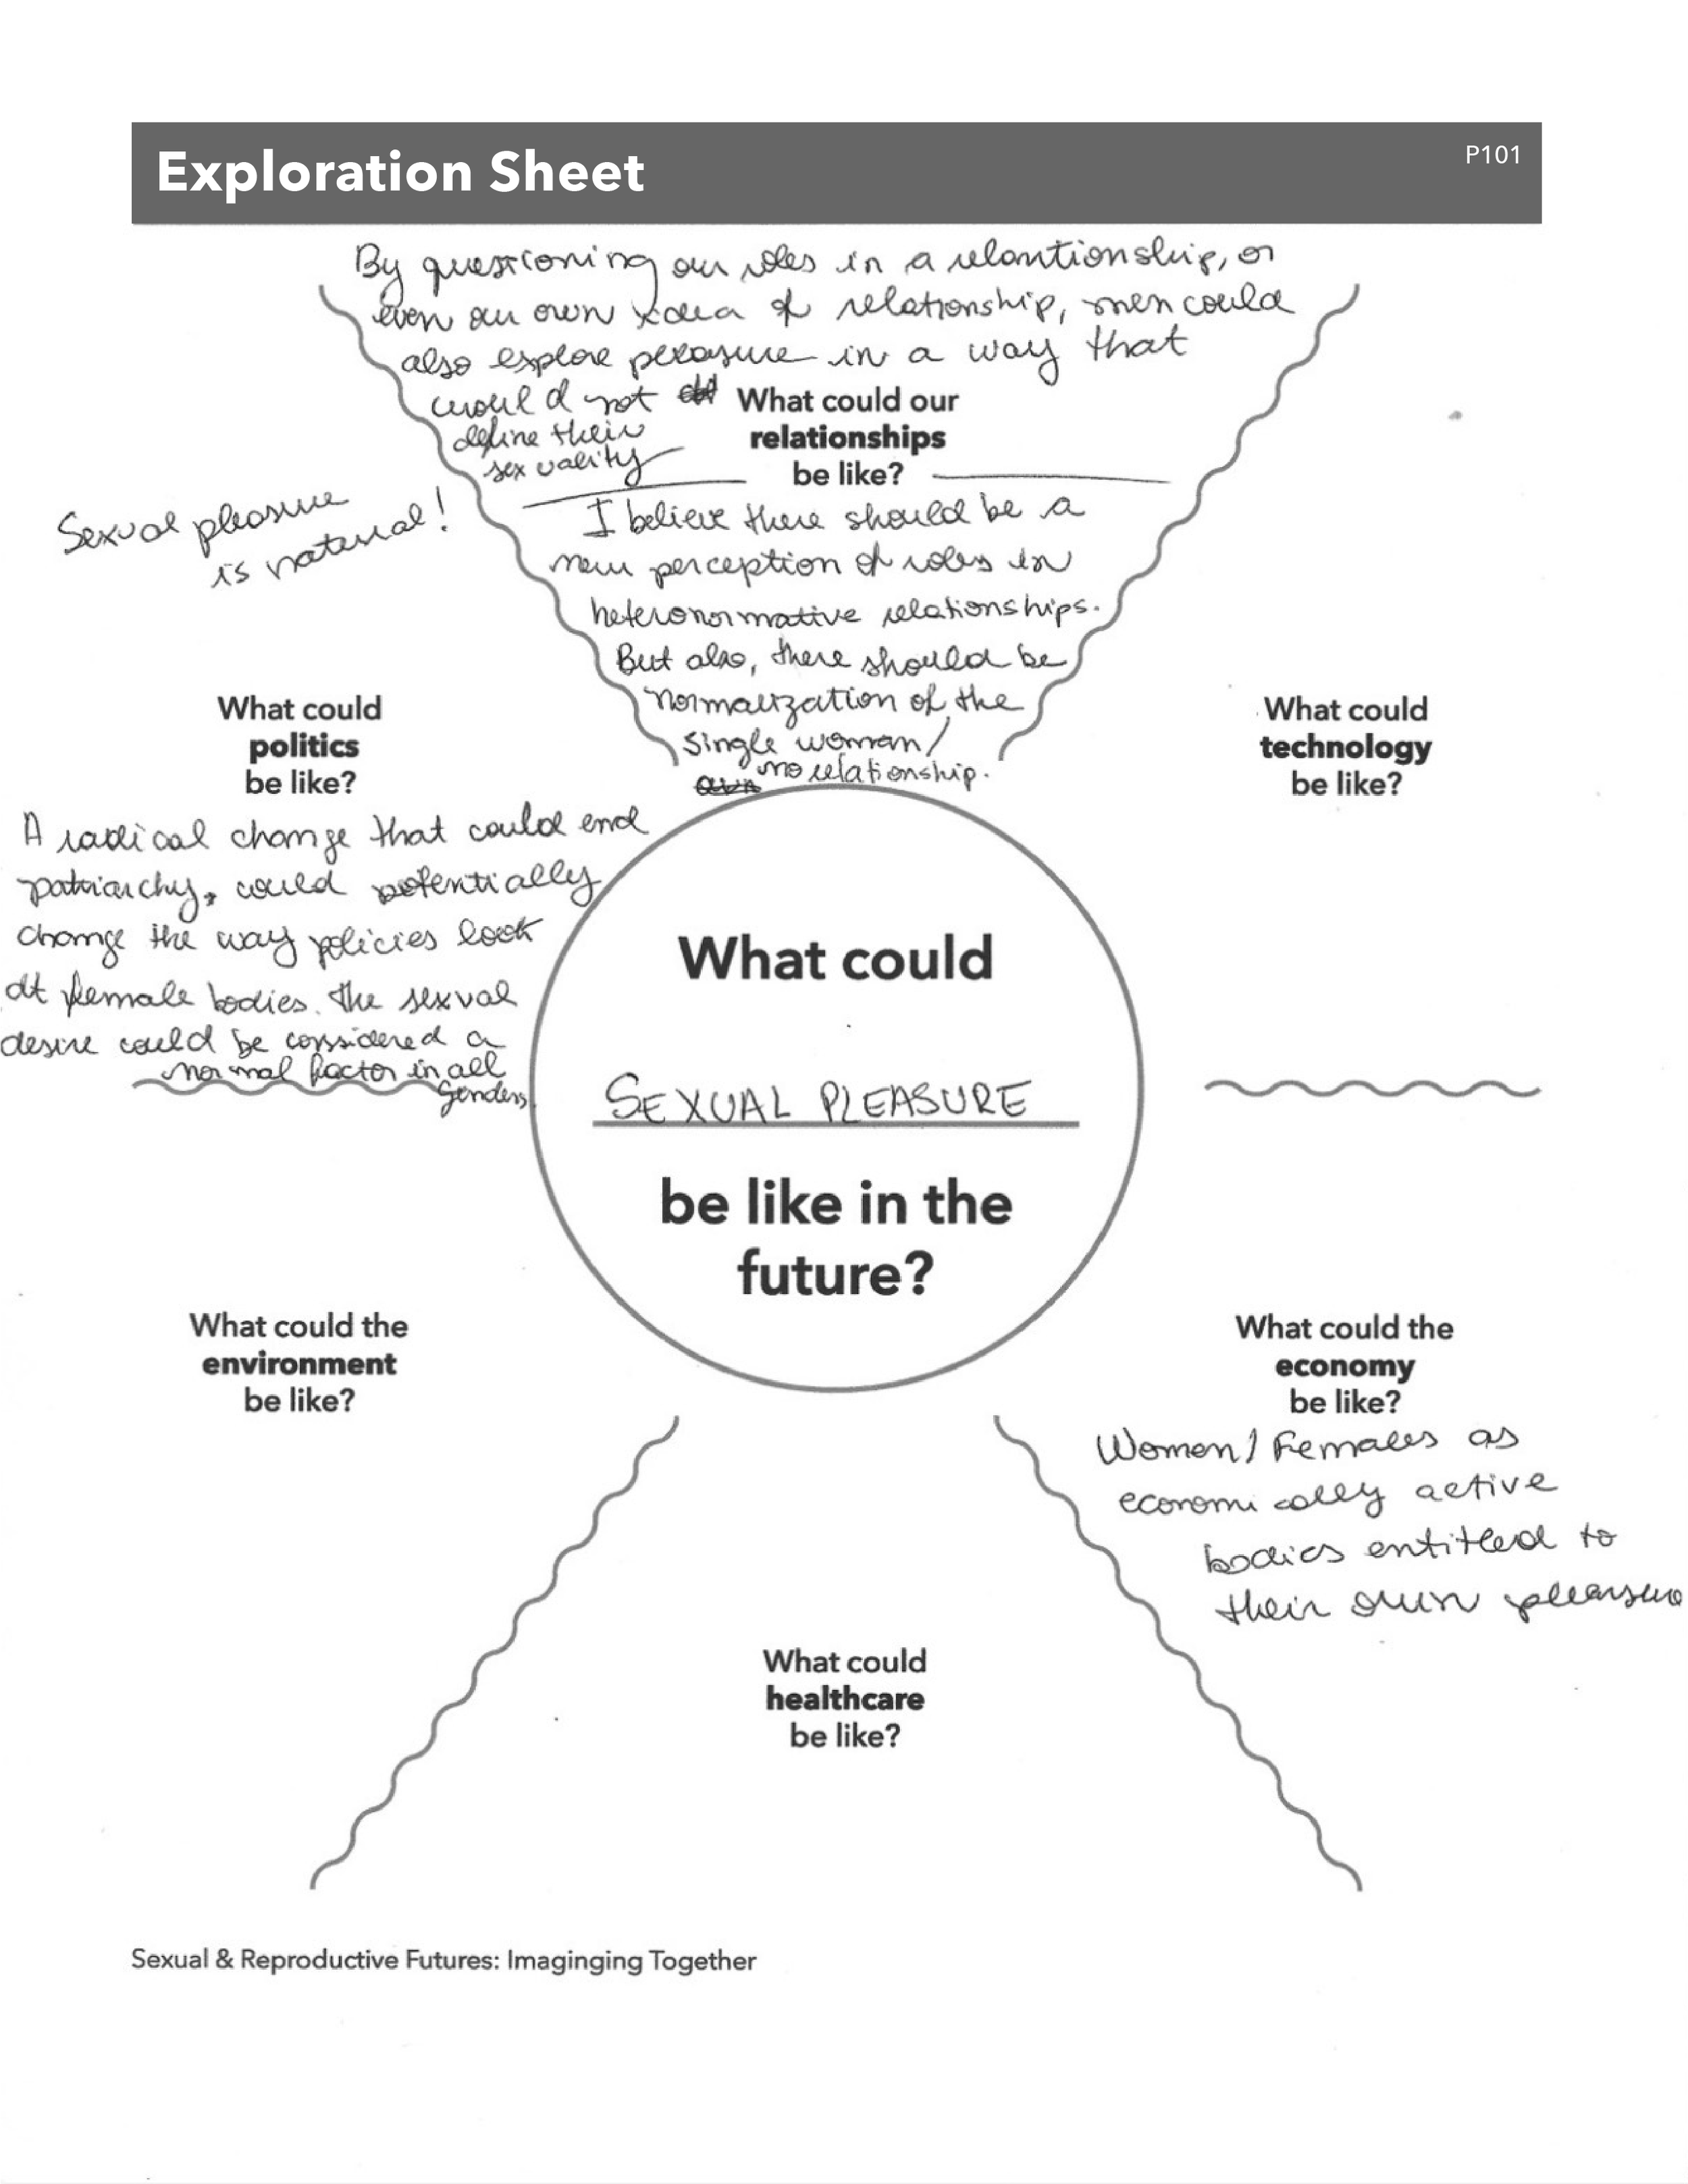
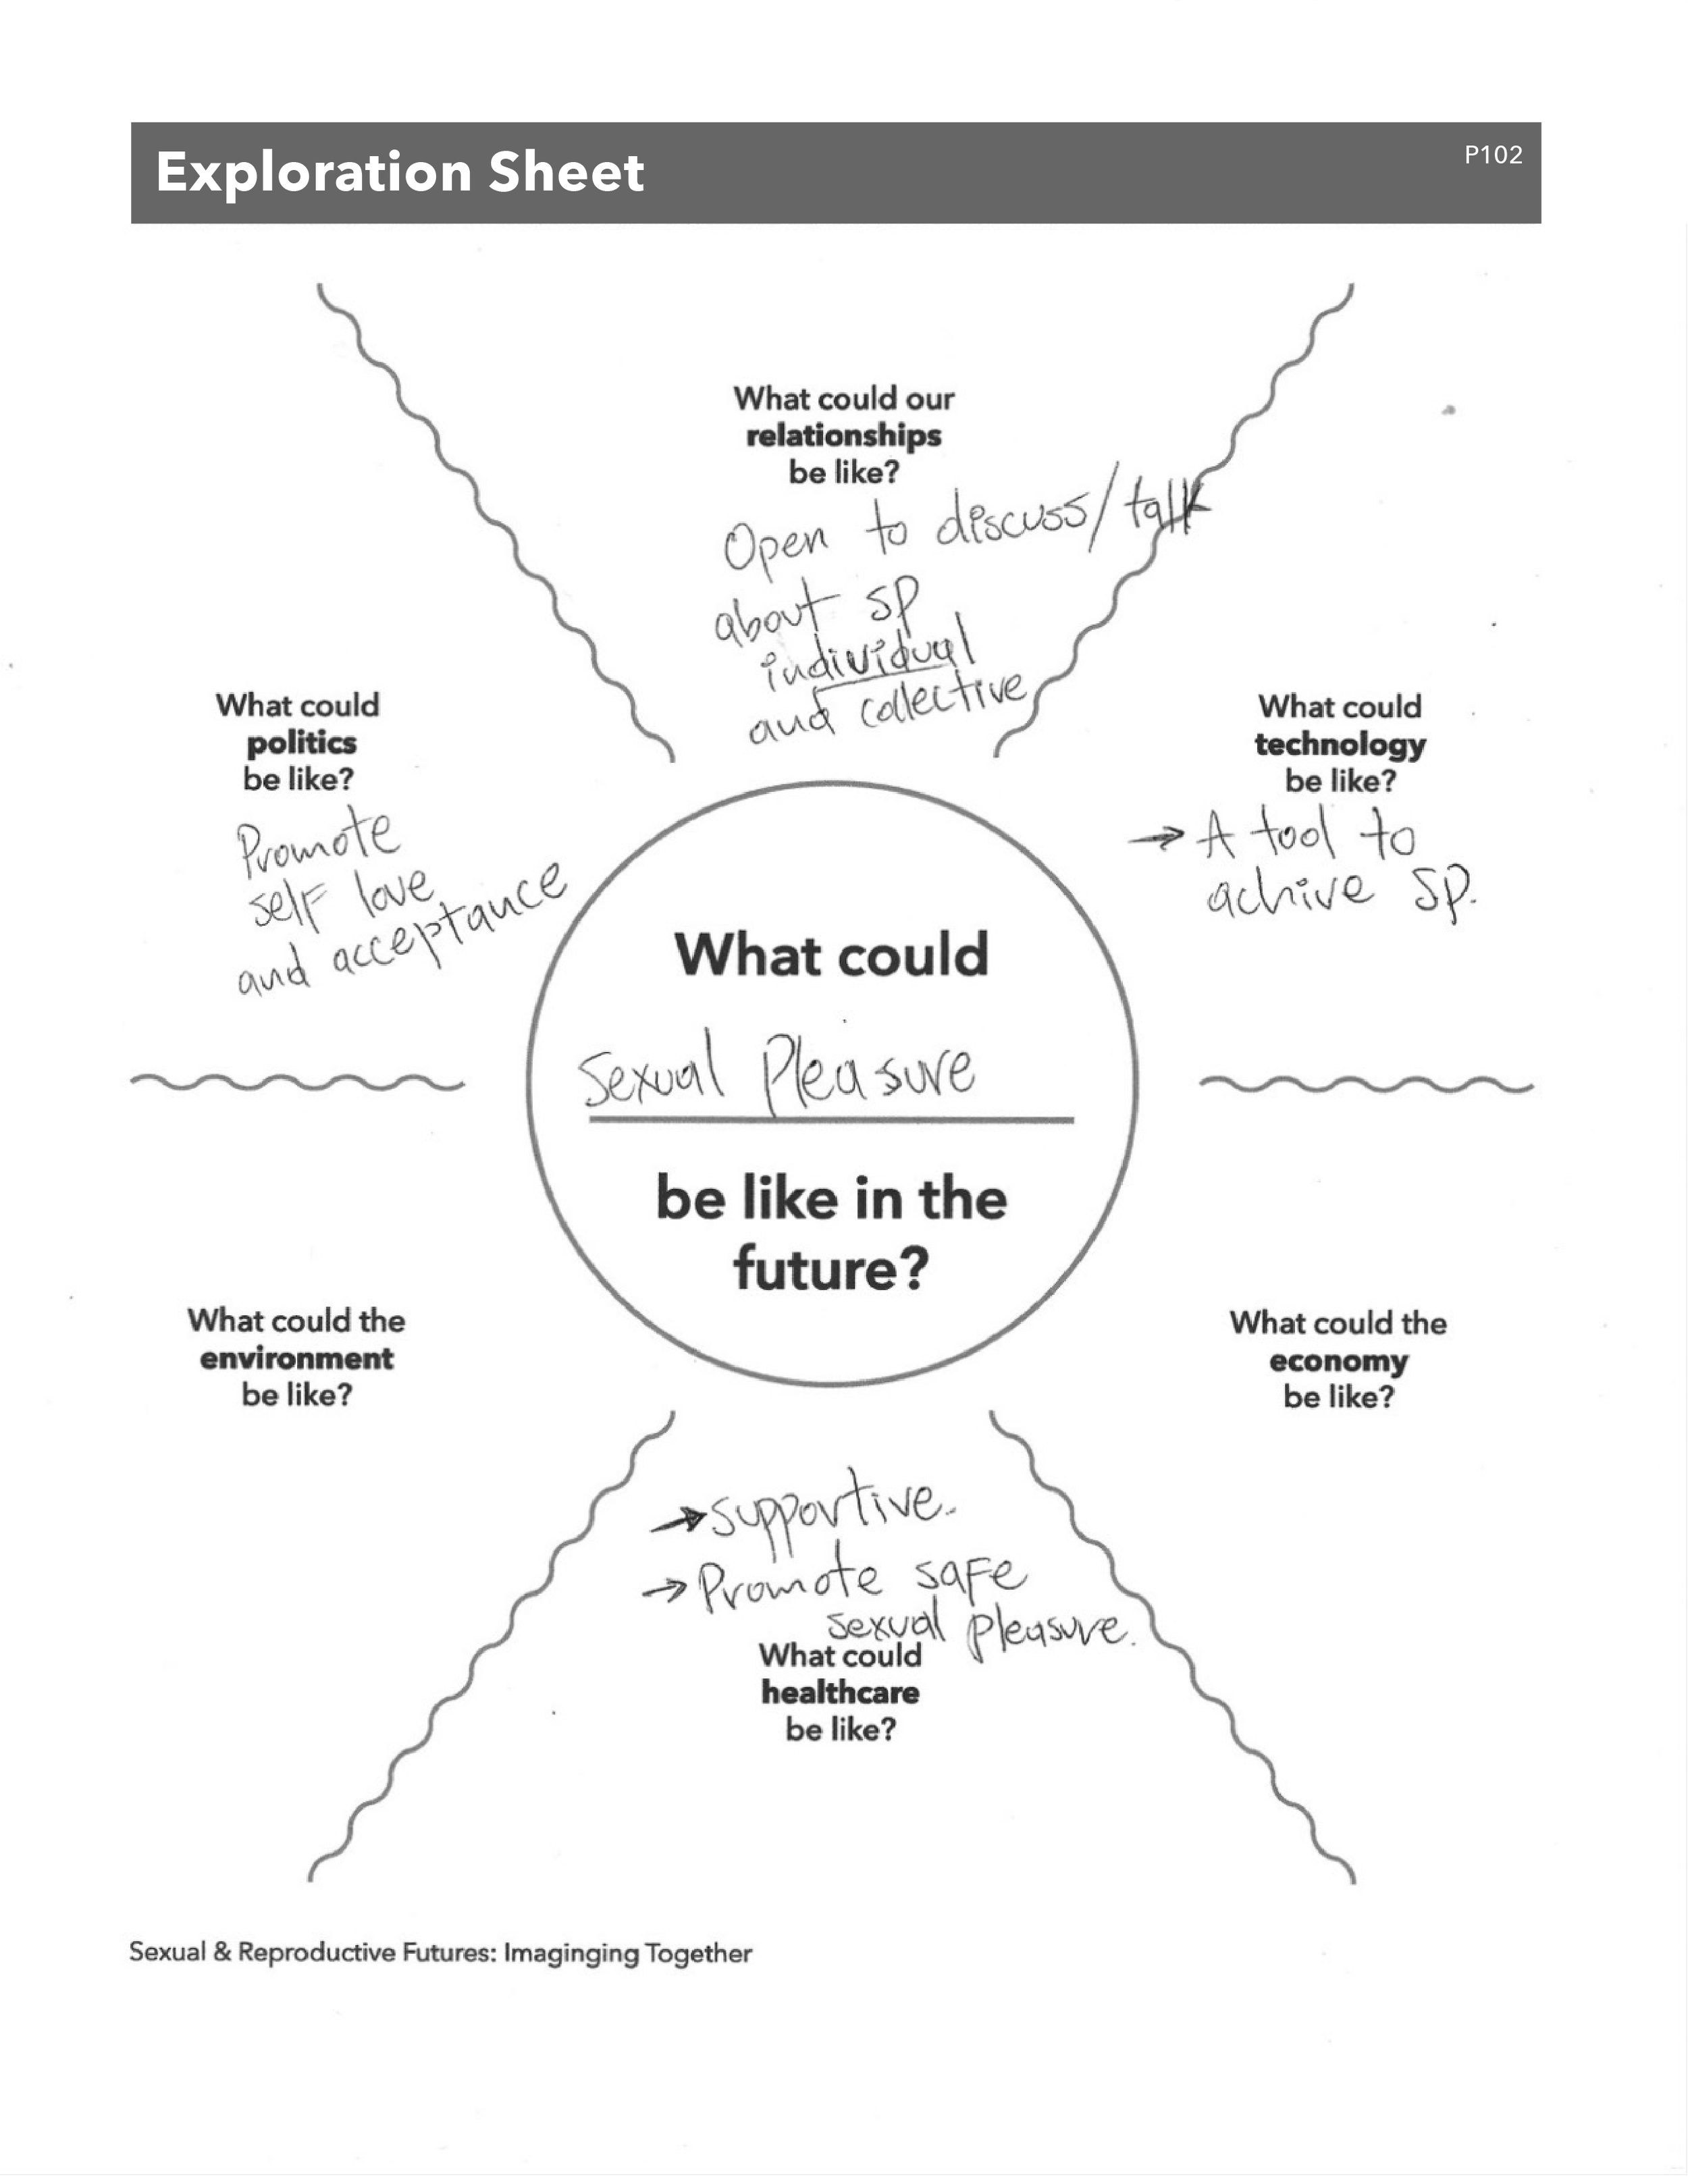
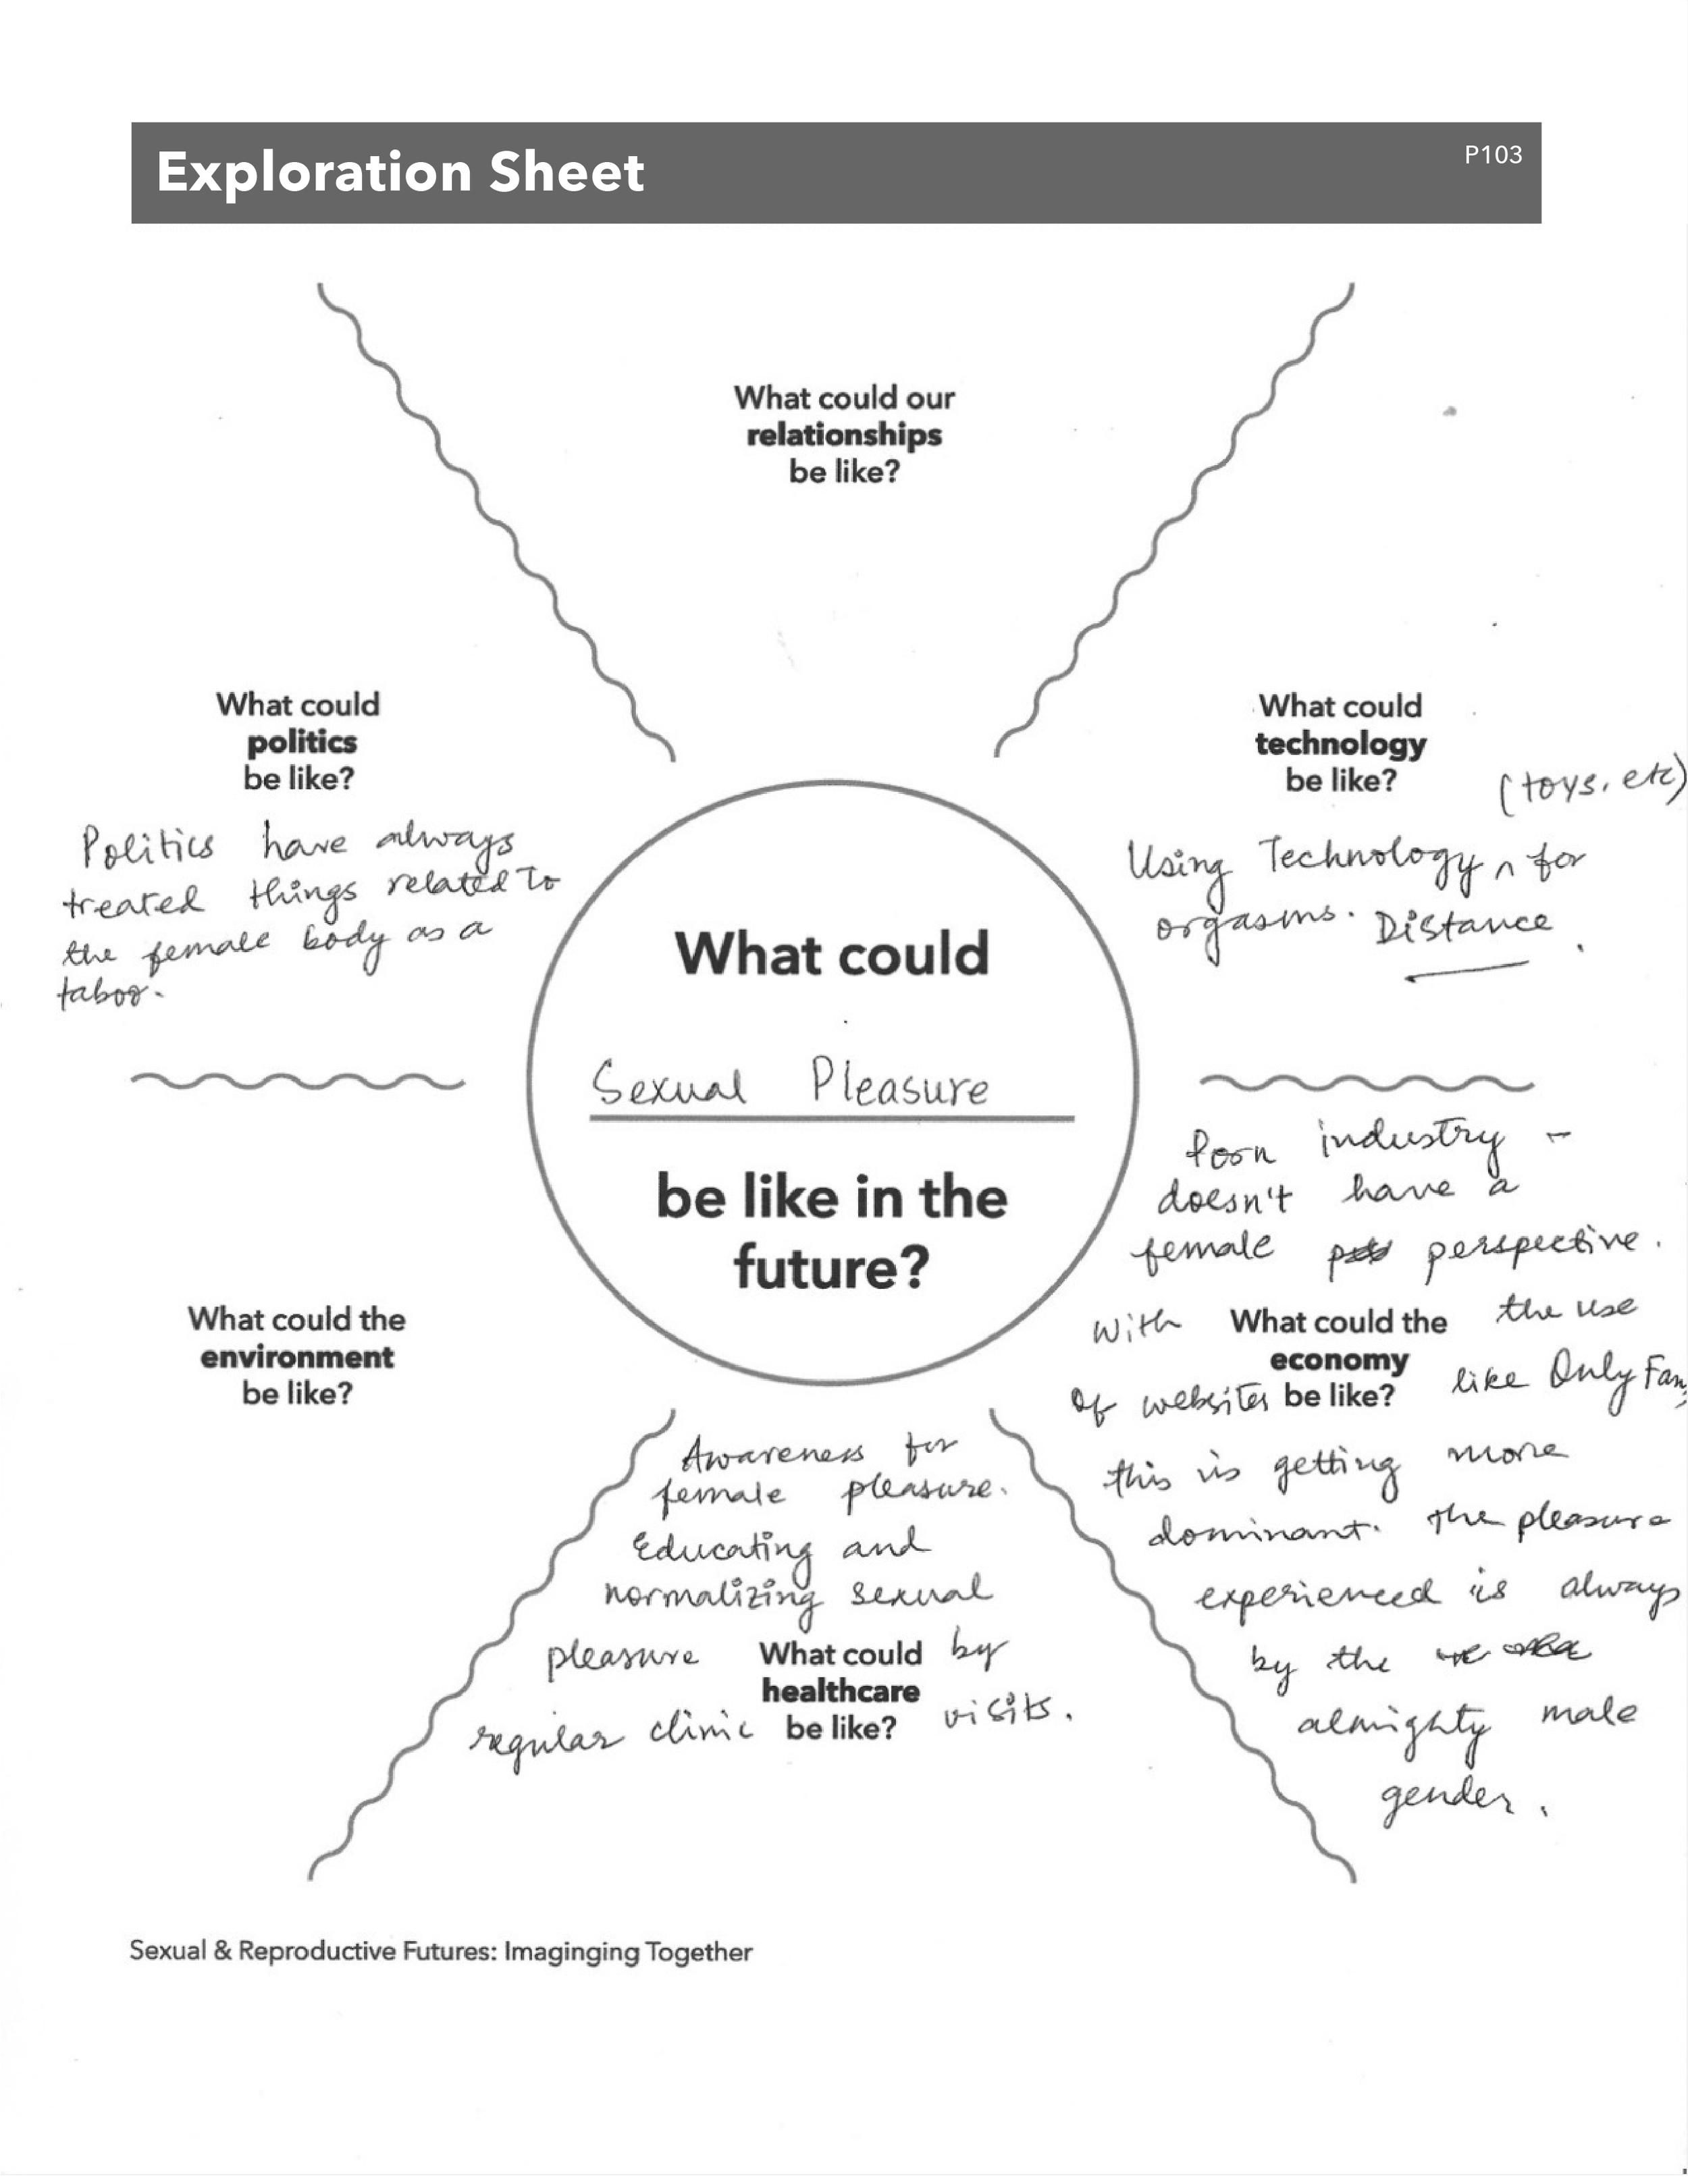
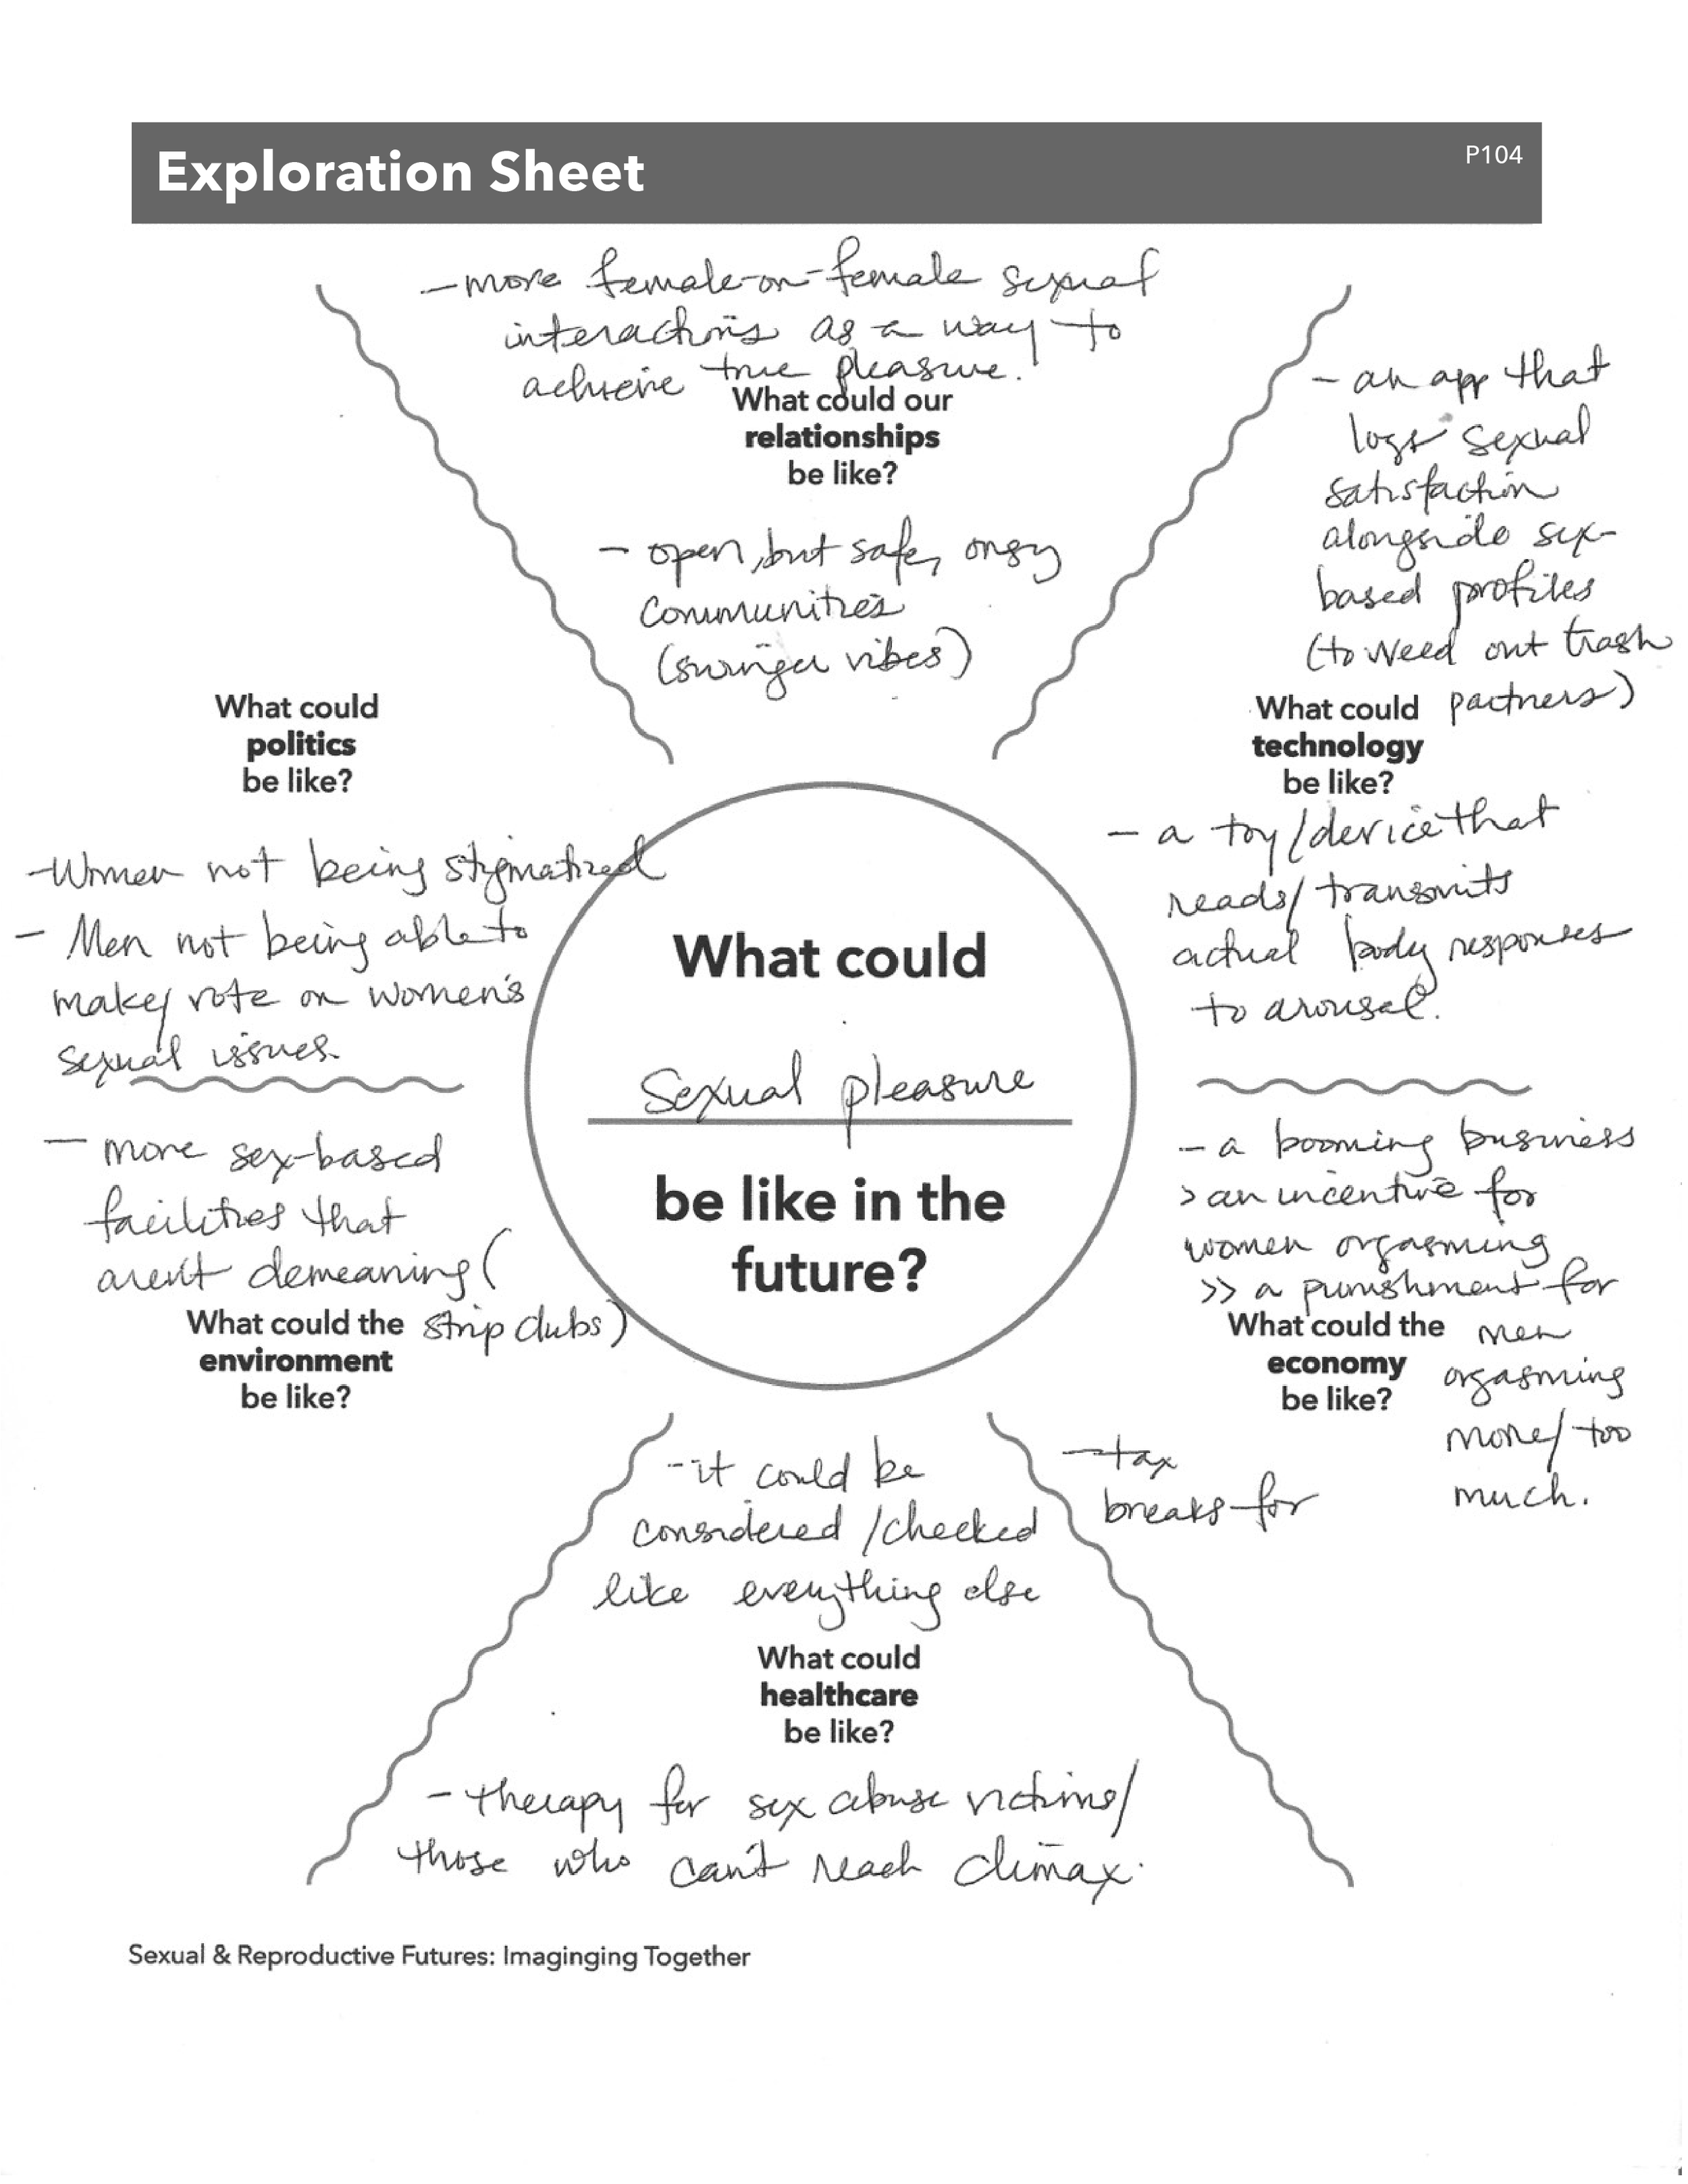


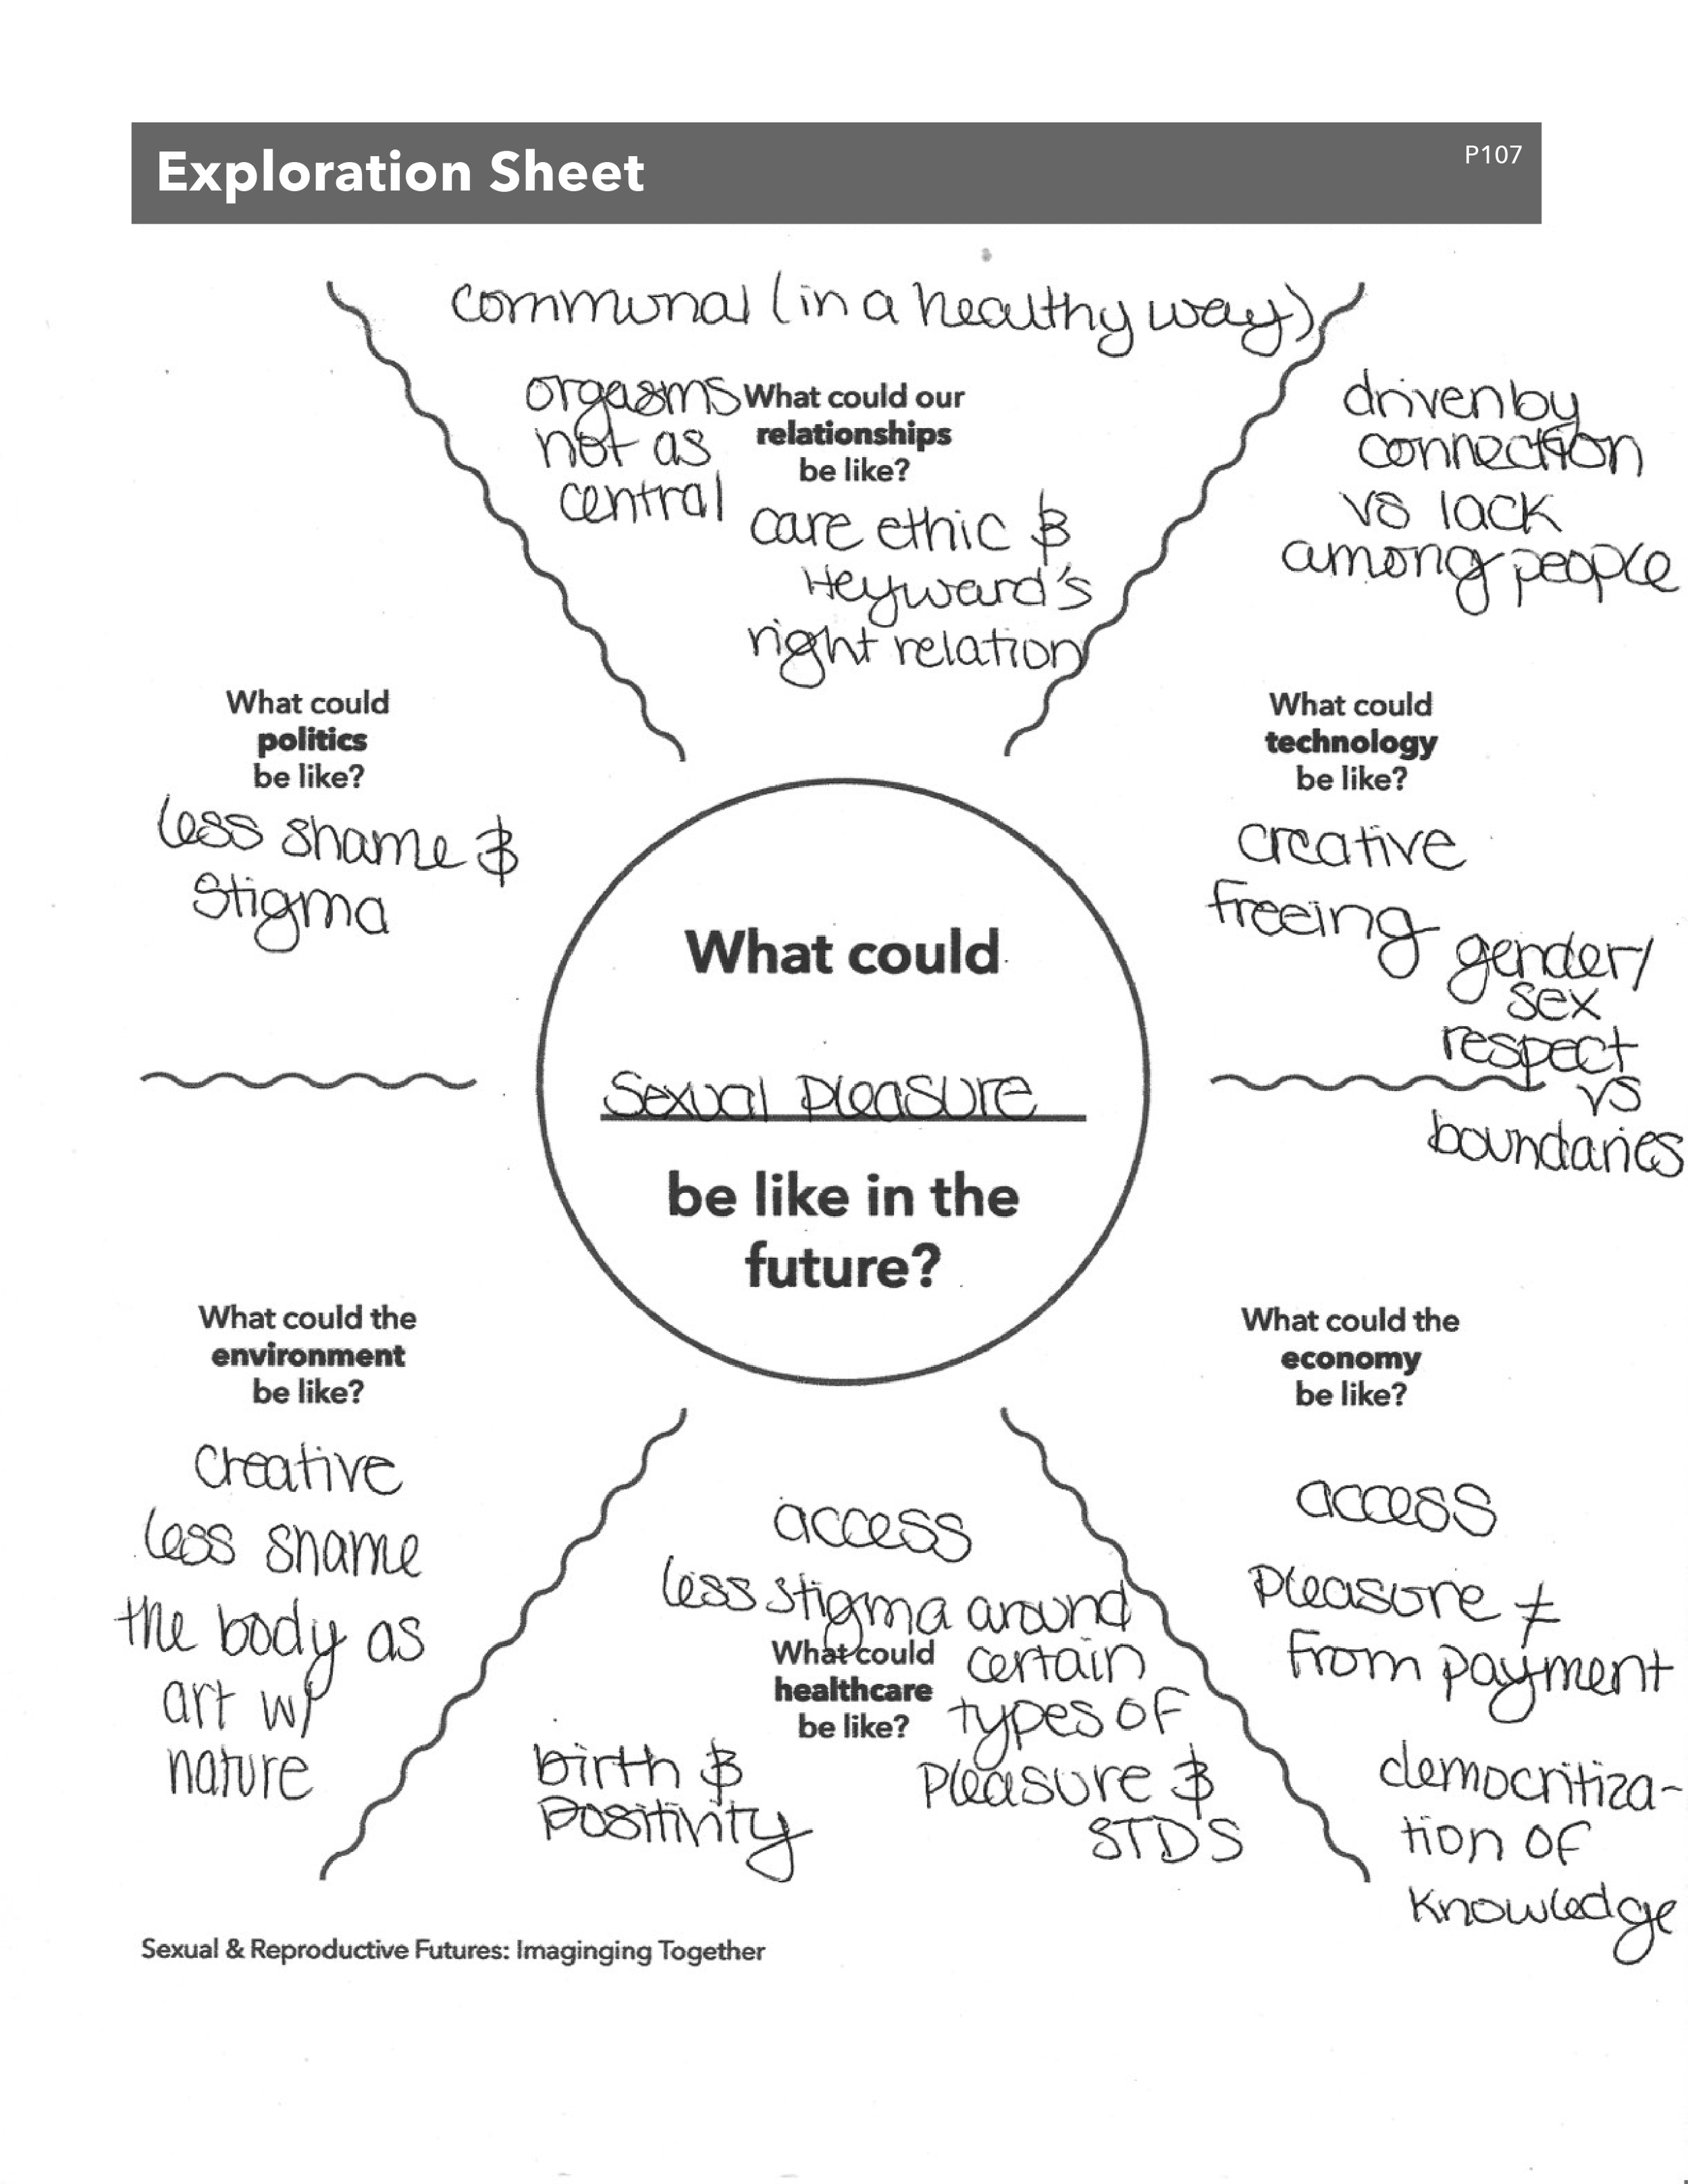


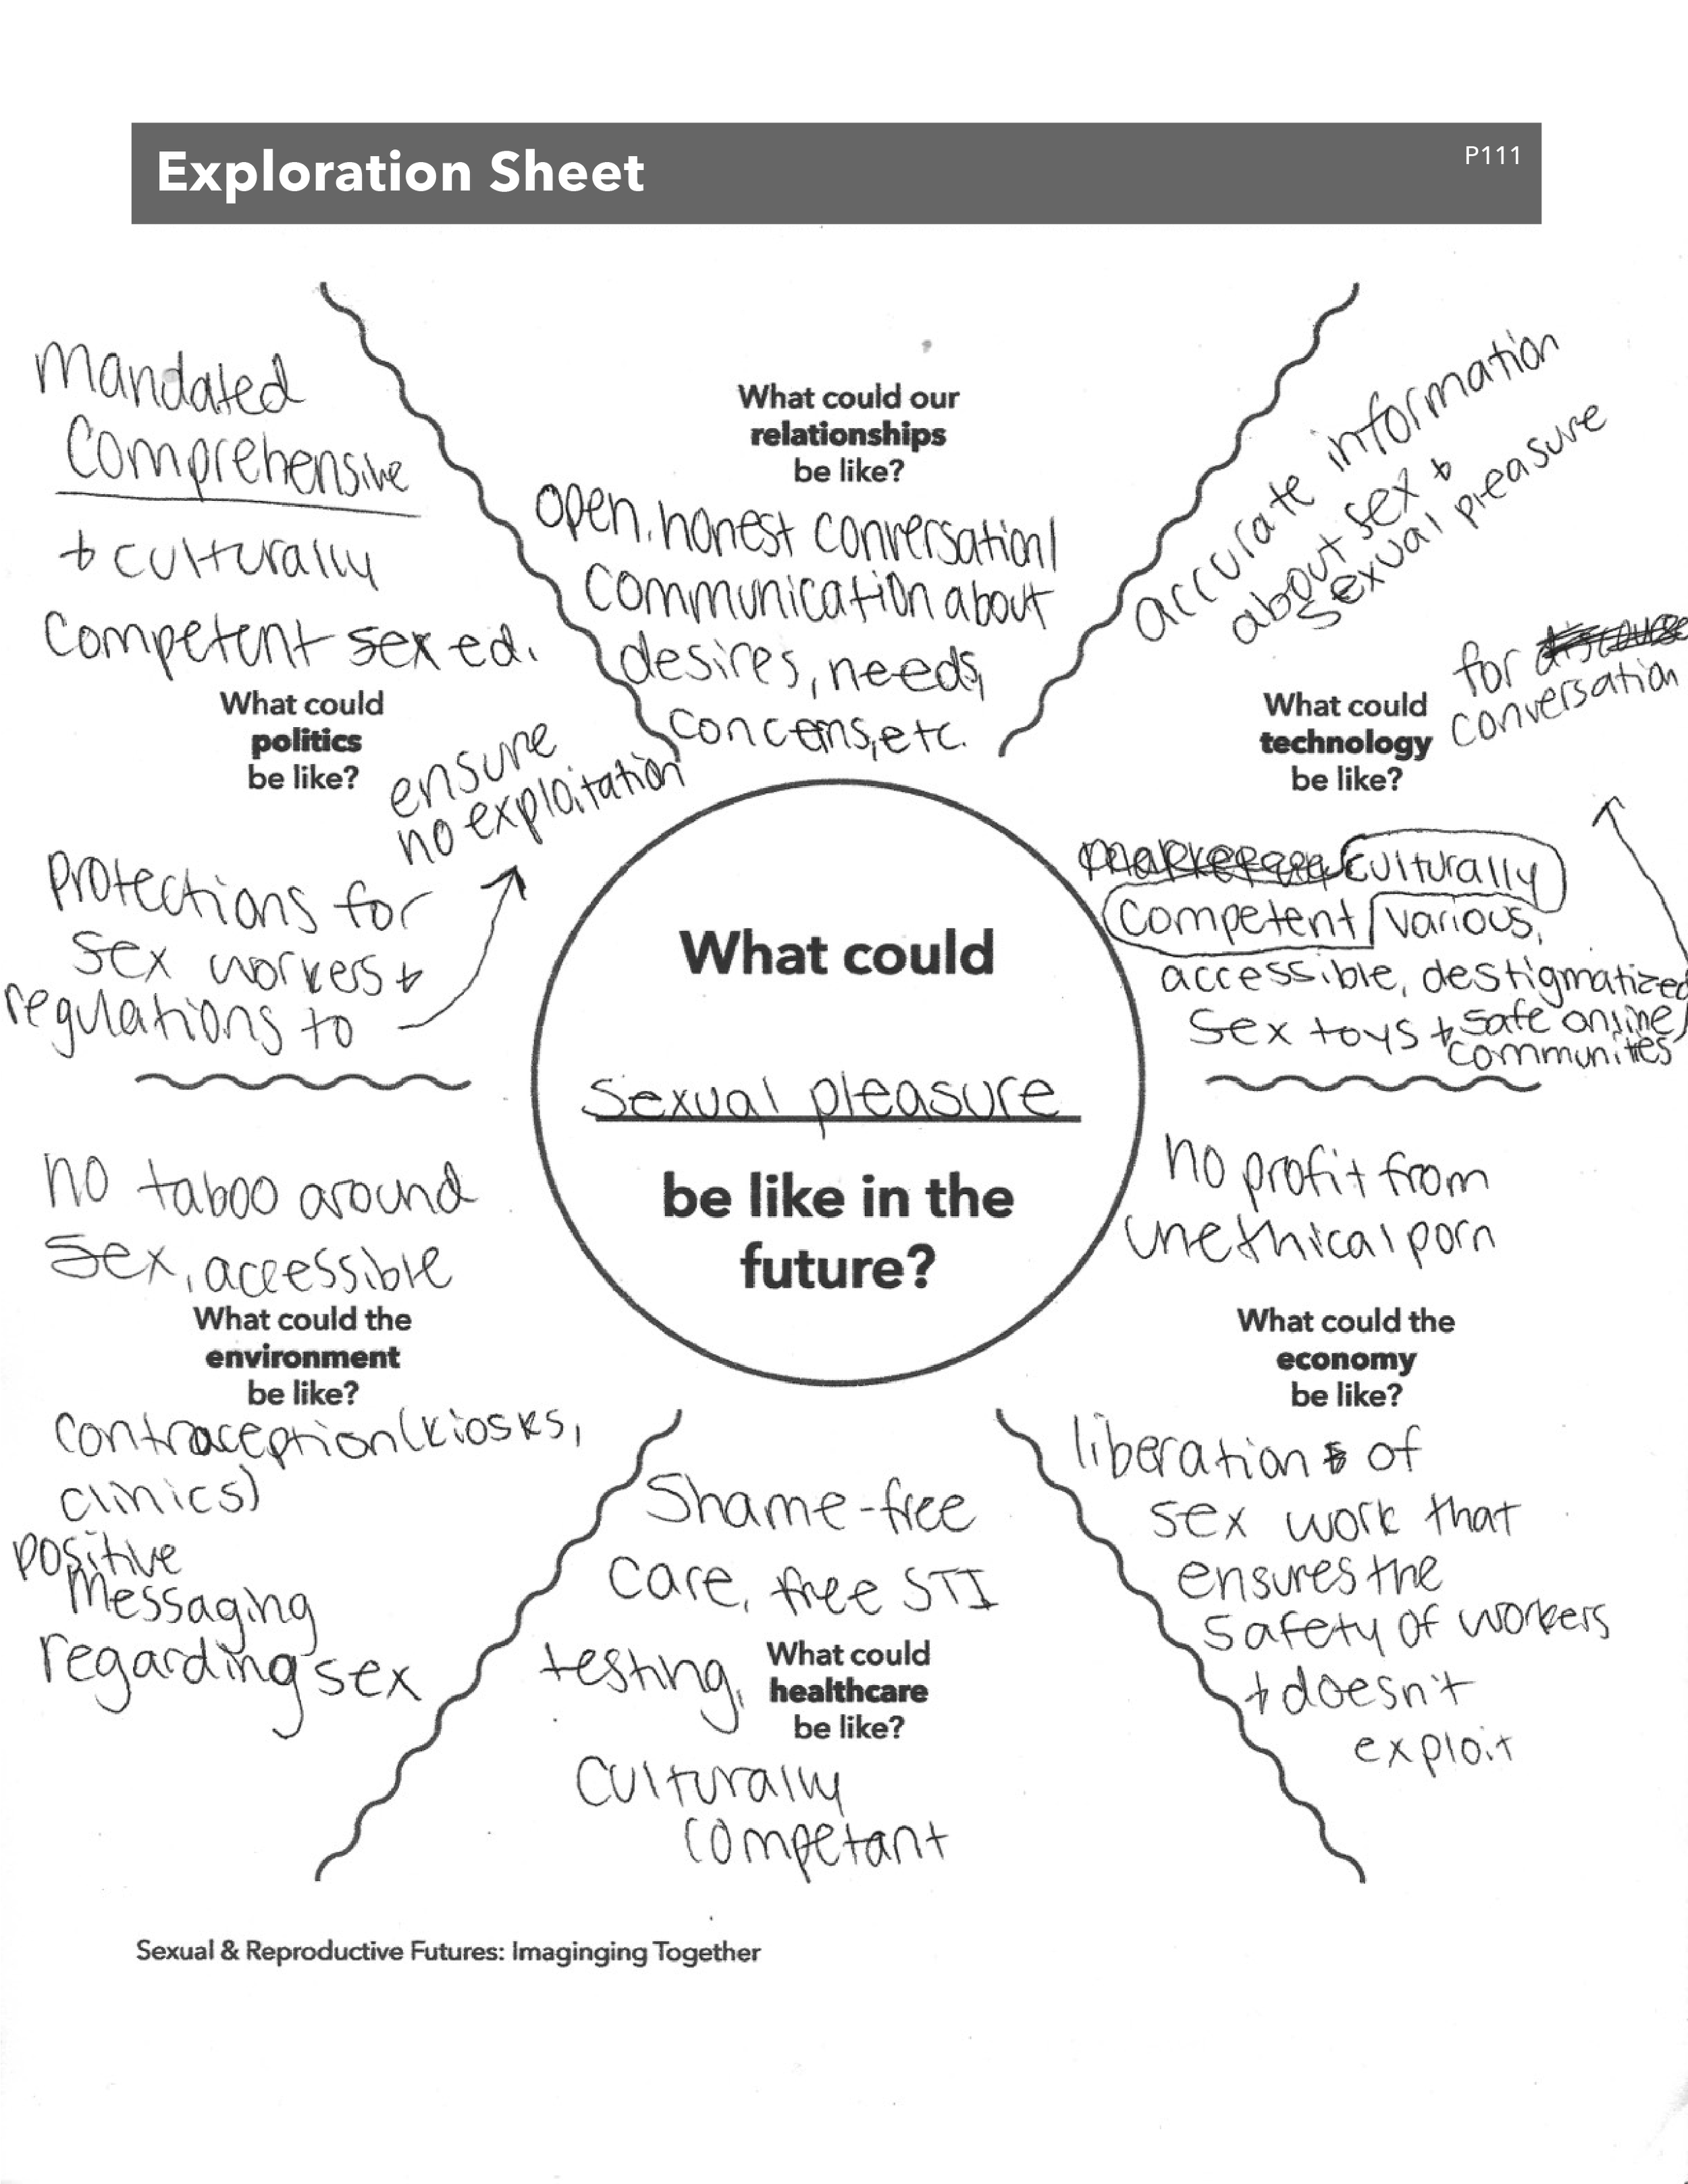
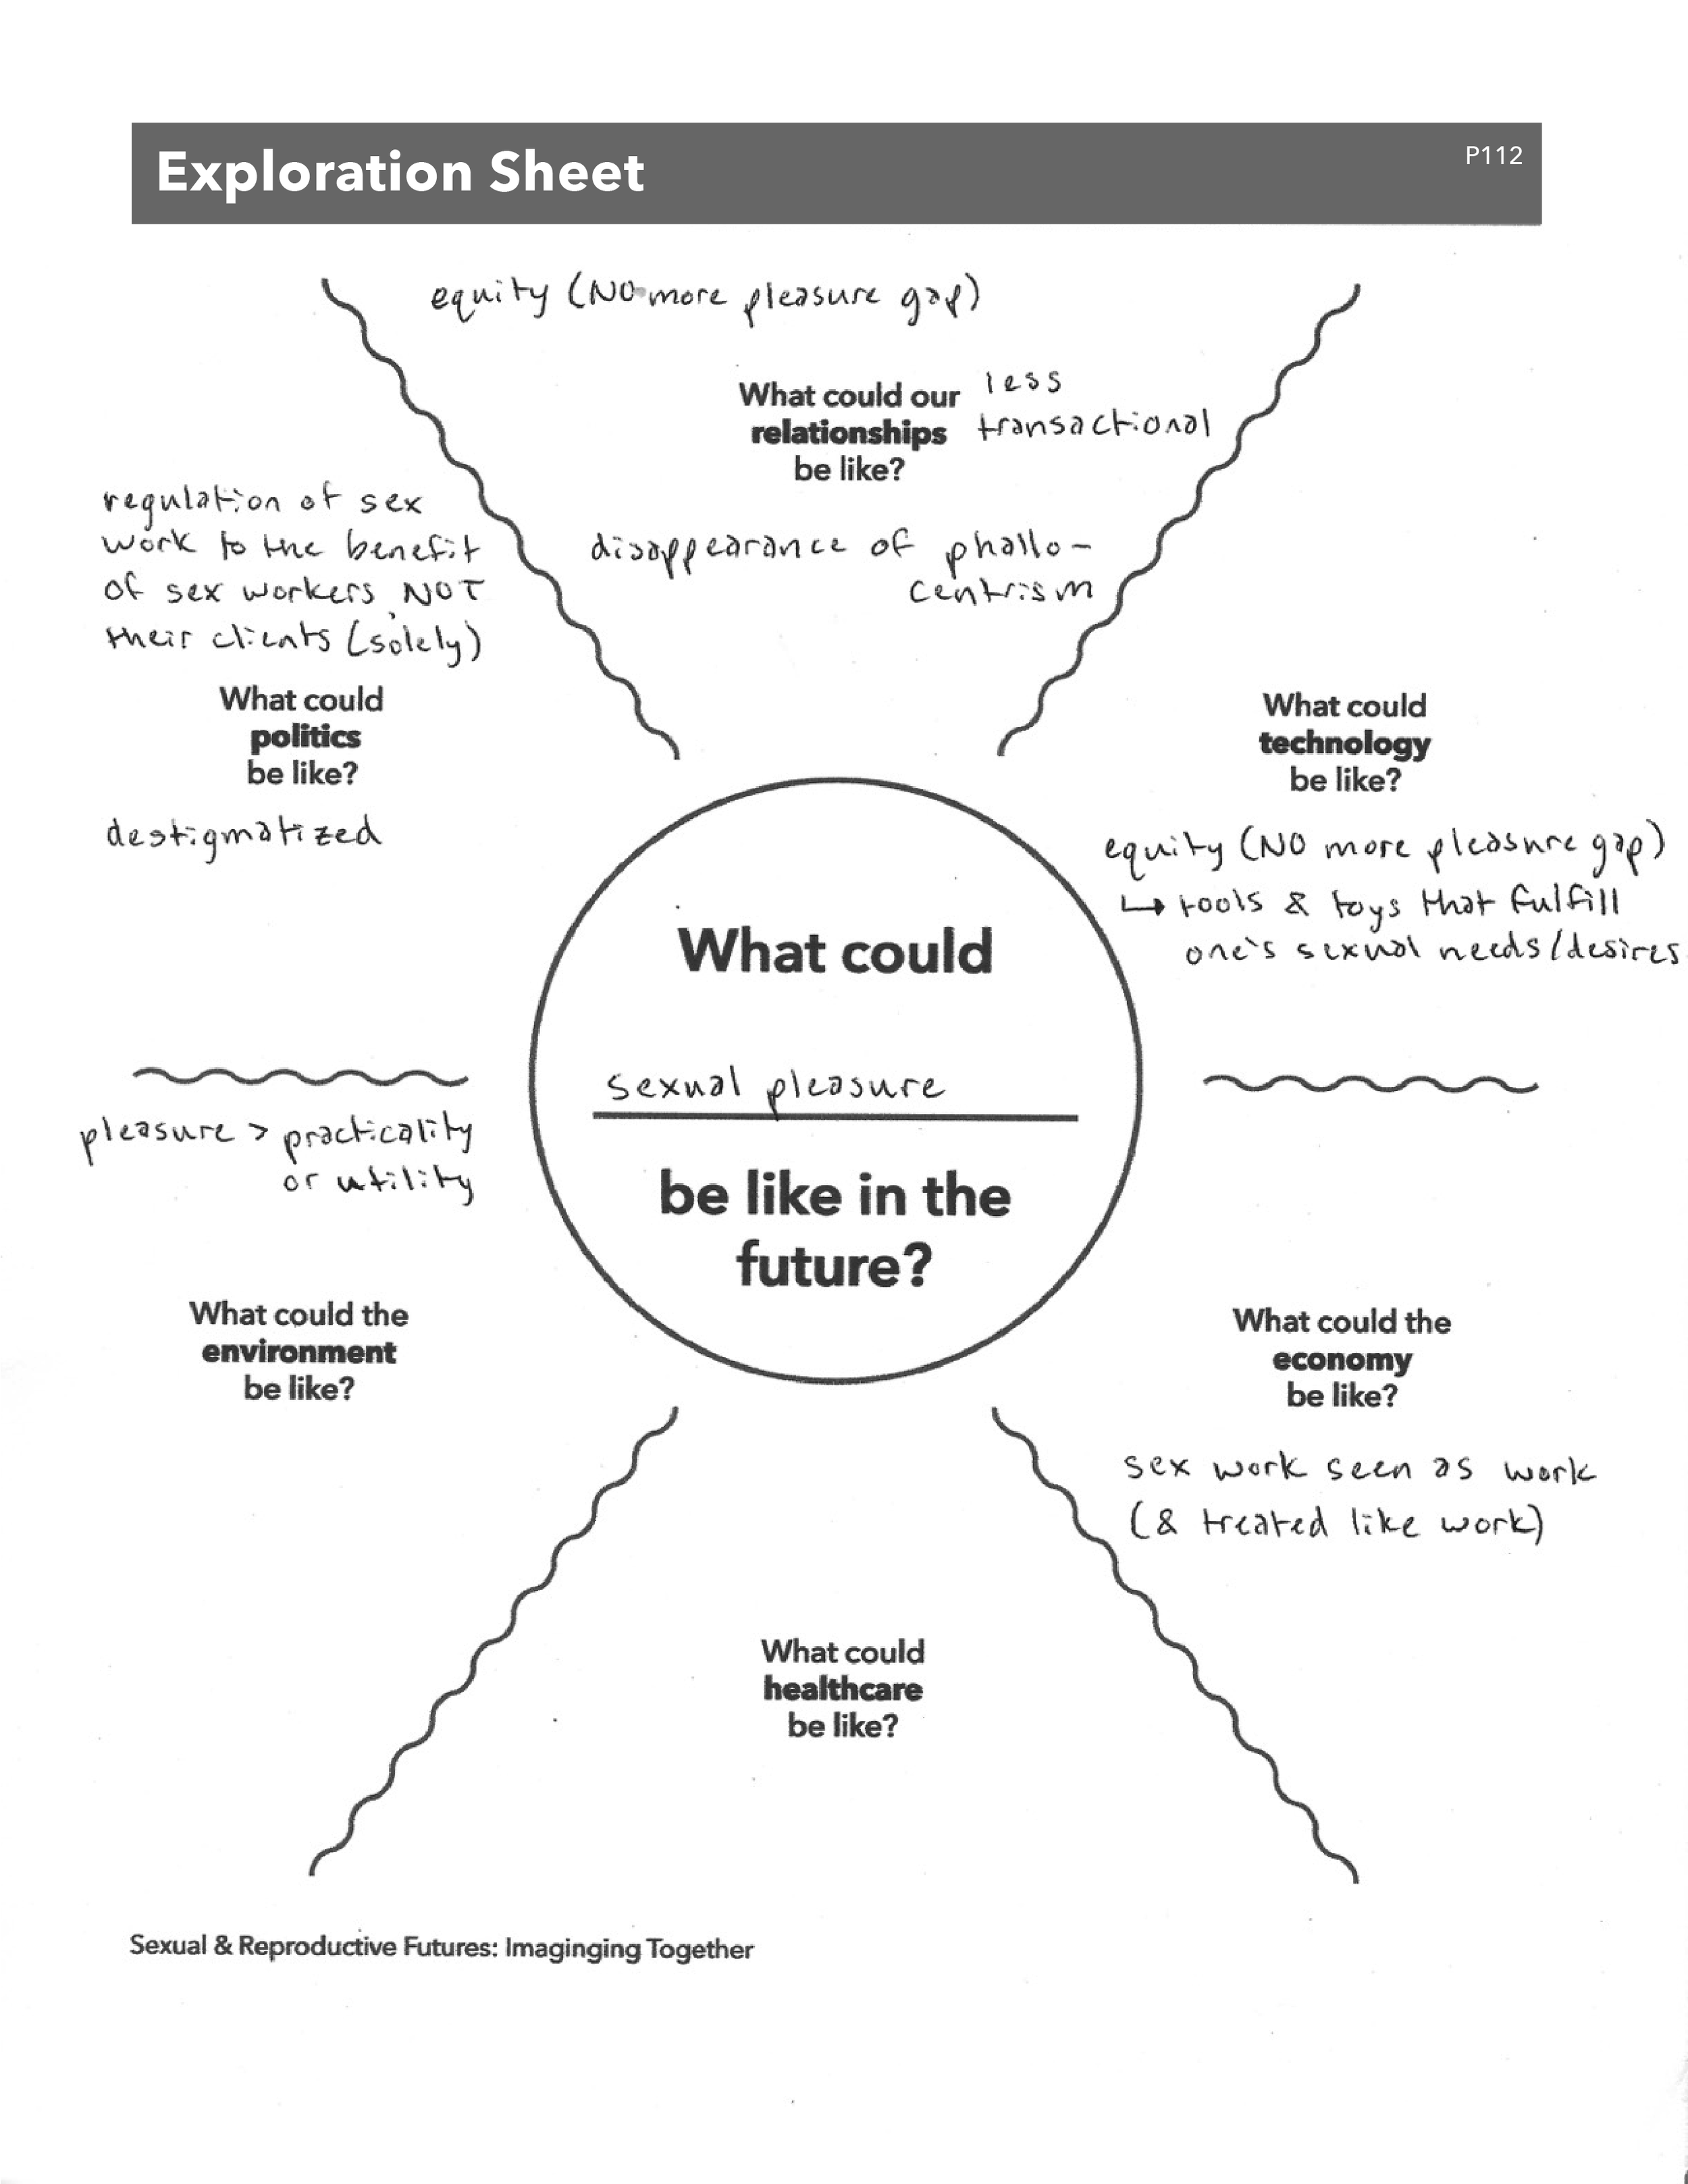


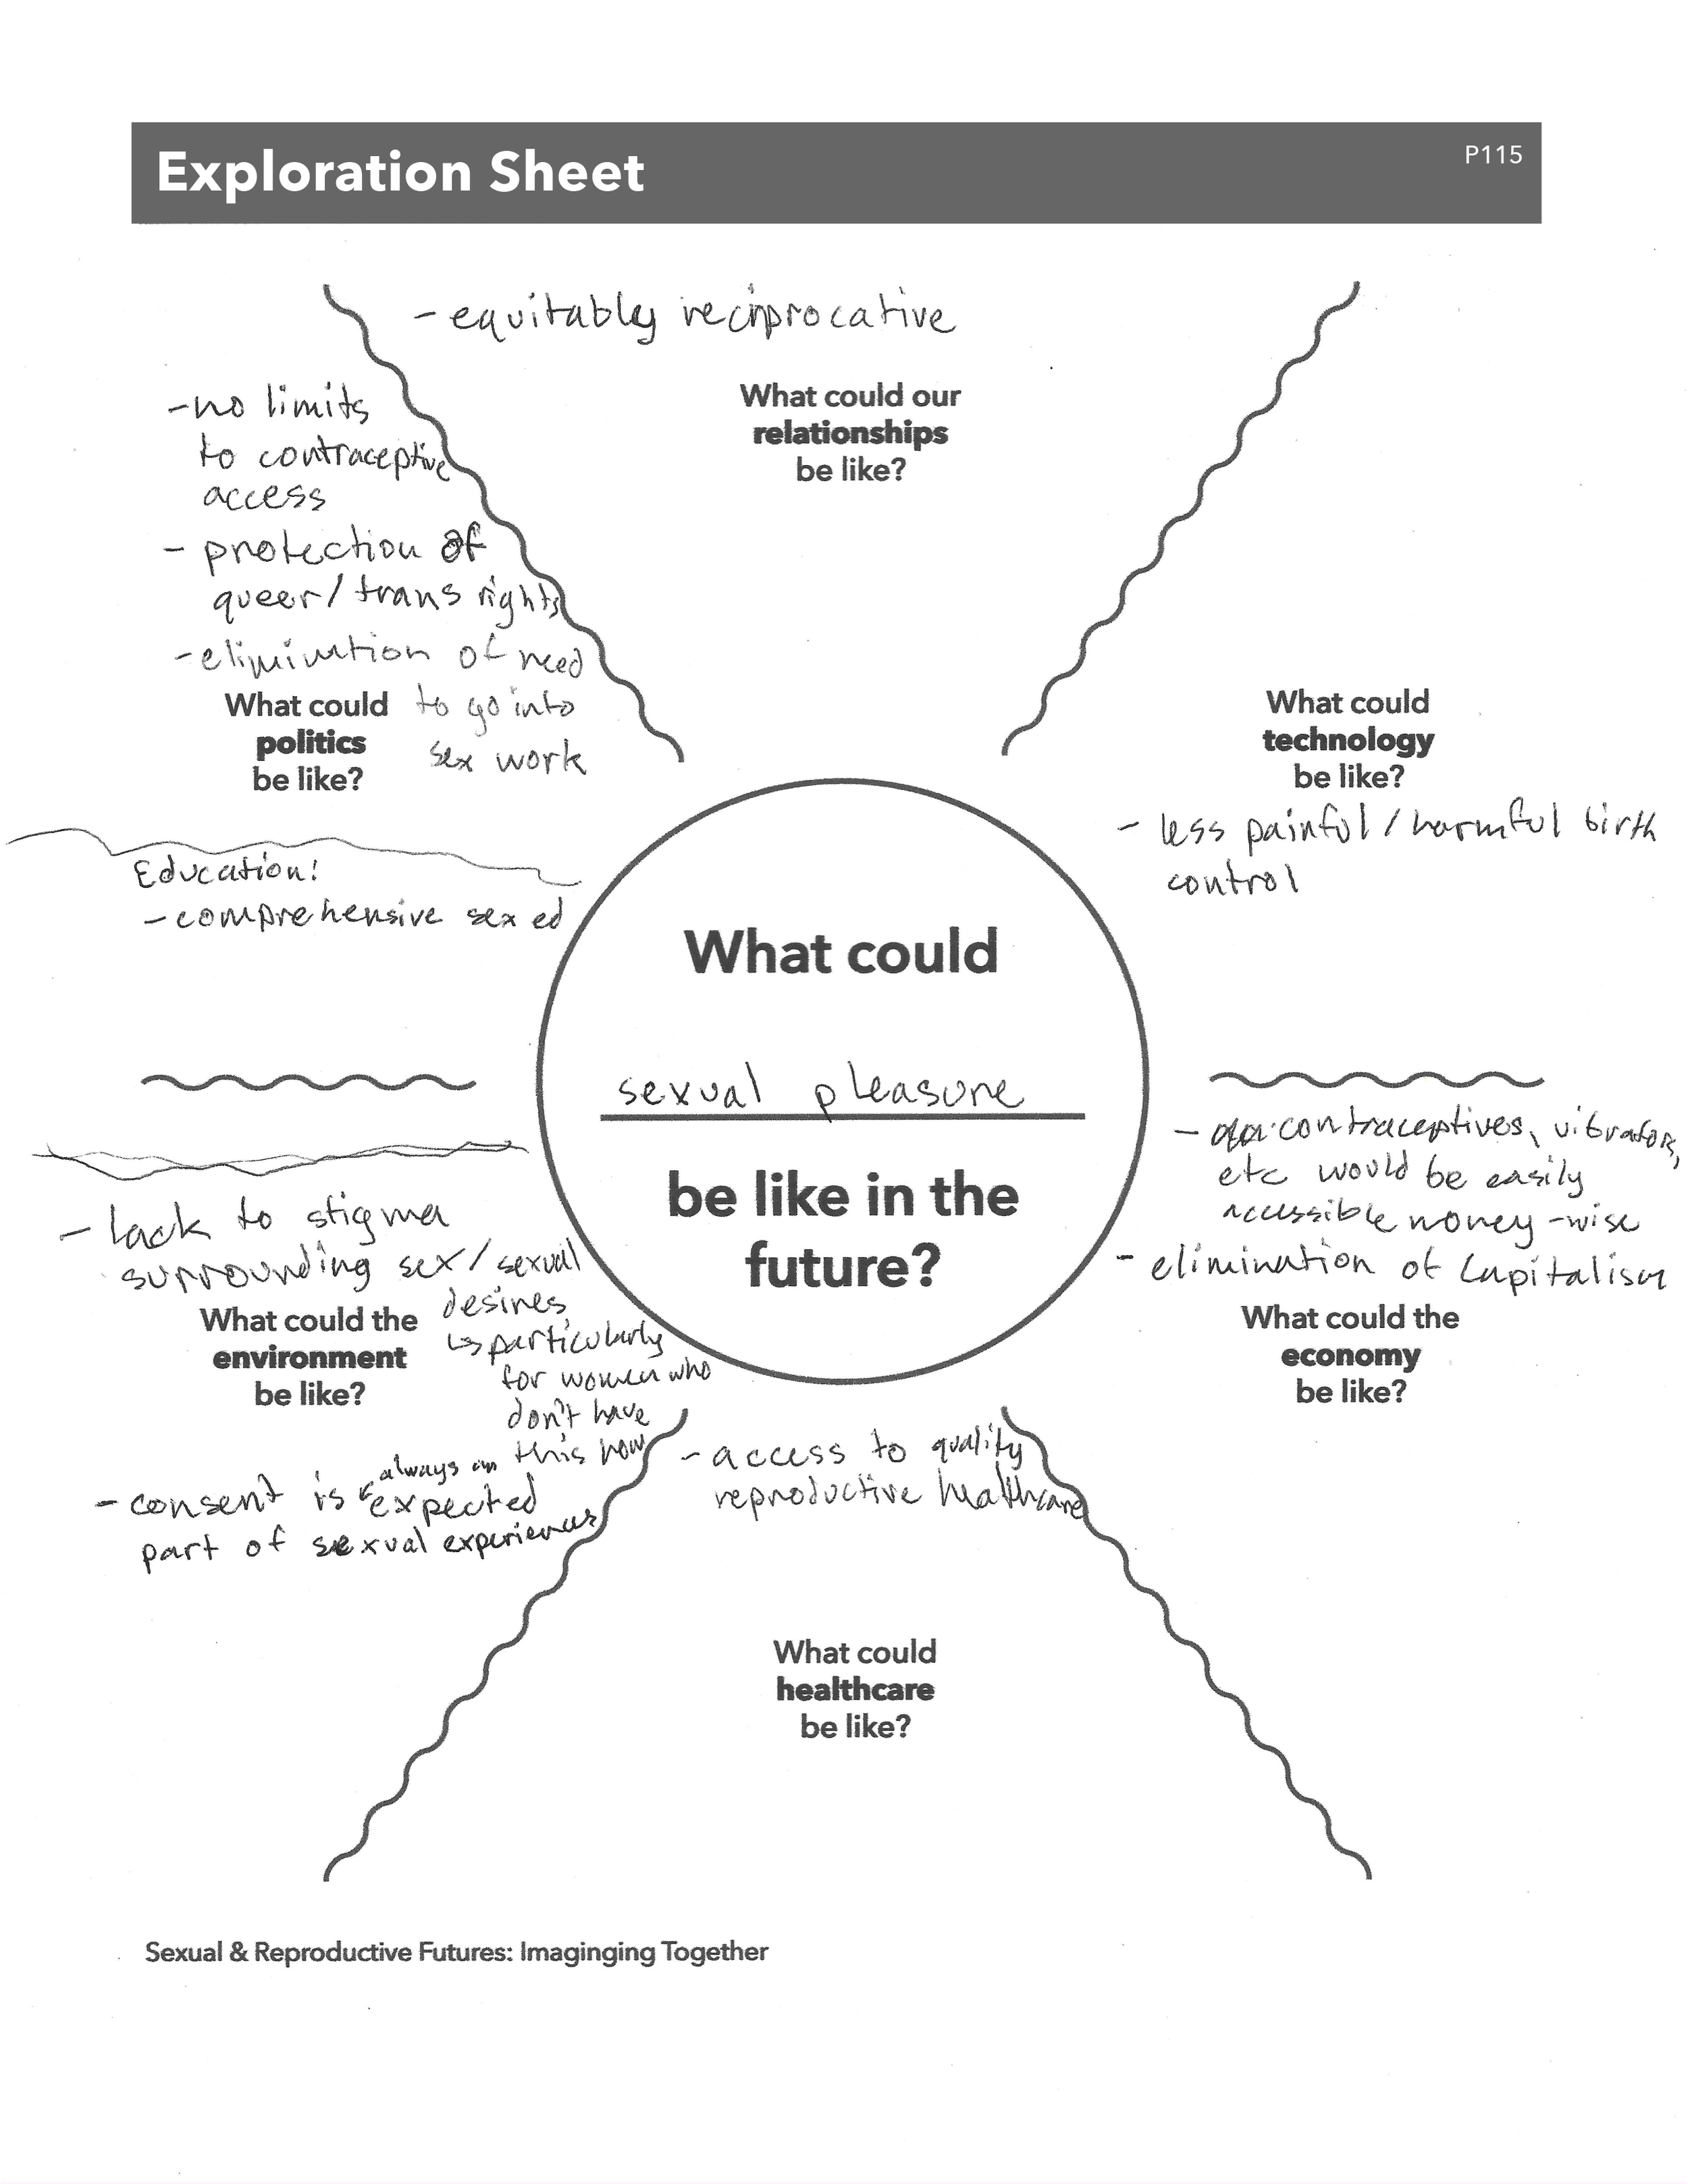


5 out of 6 groups chose Sexual Pleasure as their topic!
The groups seemed to want a fun, positive topic, avoiding more serious or upsetting topics like Abortion and Fertility.
Almost all of ideas written on the worksheets were positive.
Participants wanted to imagine preferable futures.
Artifacts
To make sense of the data relating to the artifacts from the future, I explored…How do the artifacts fit on a futures cone?
What does it look like to compare them within categories?
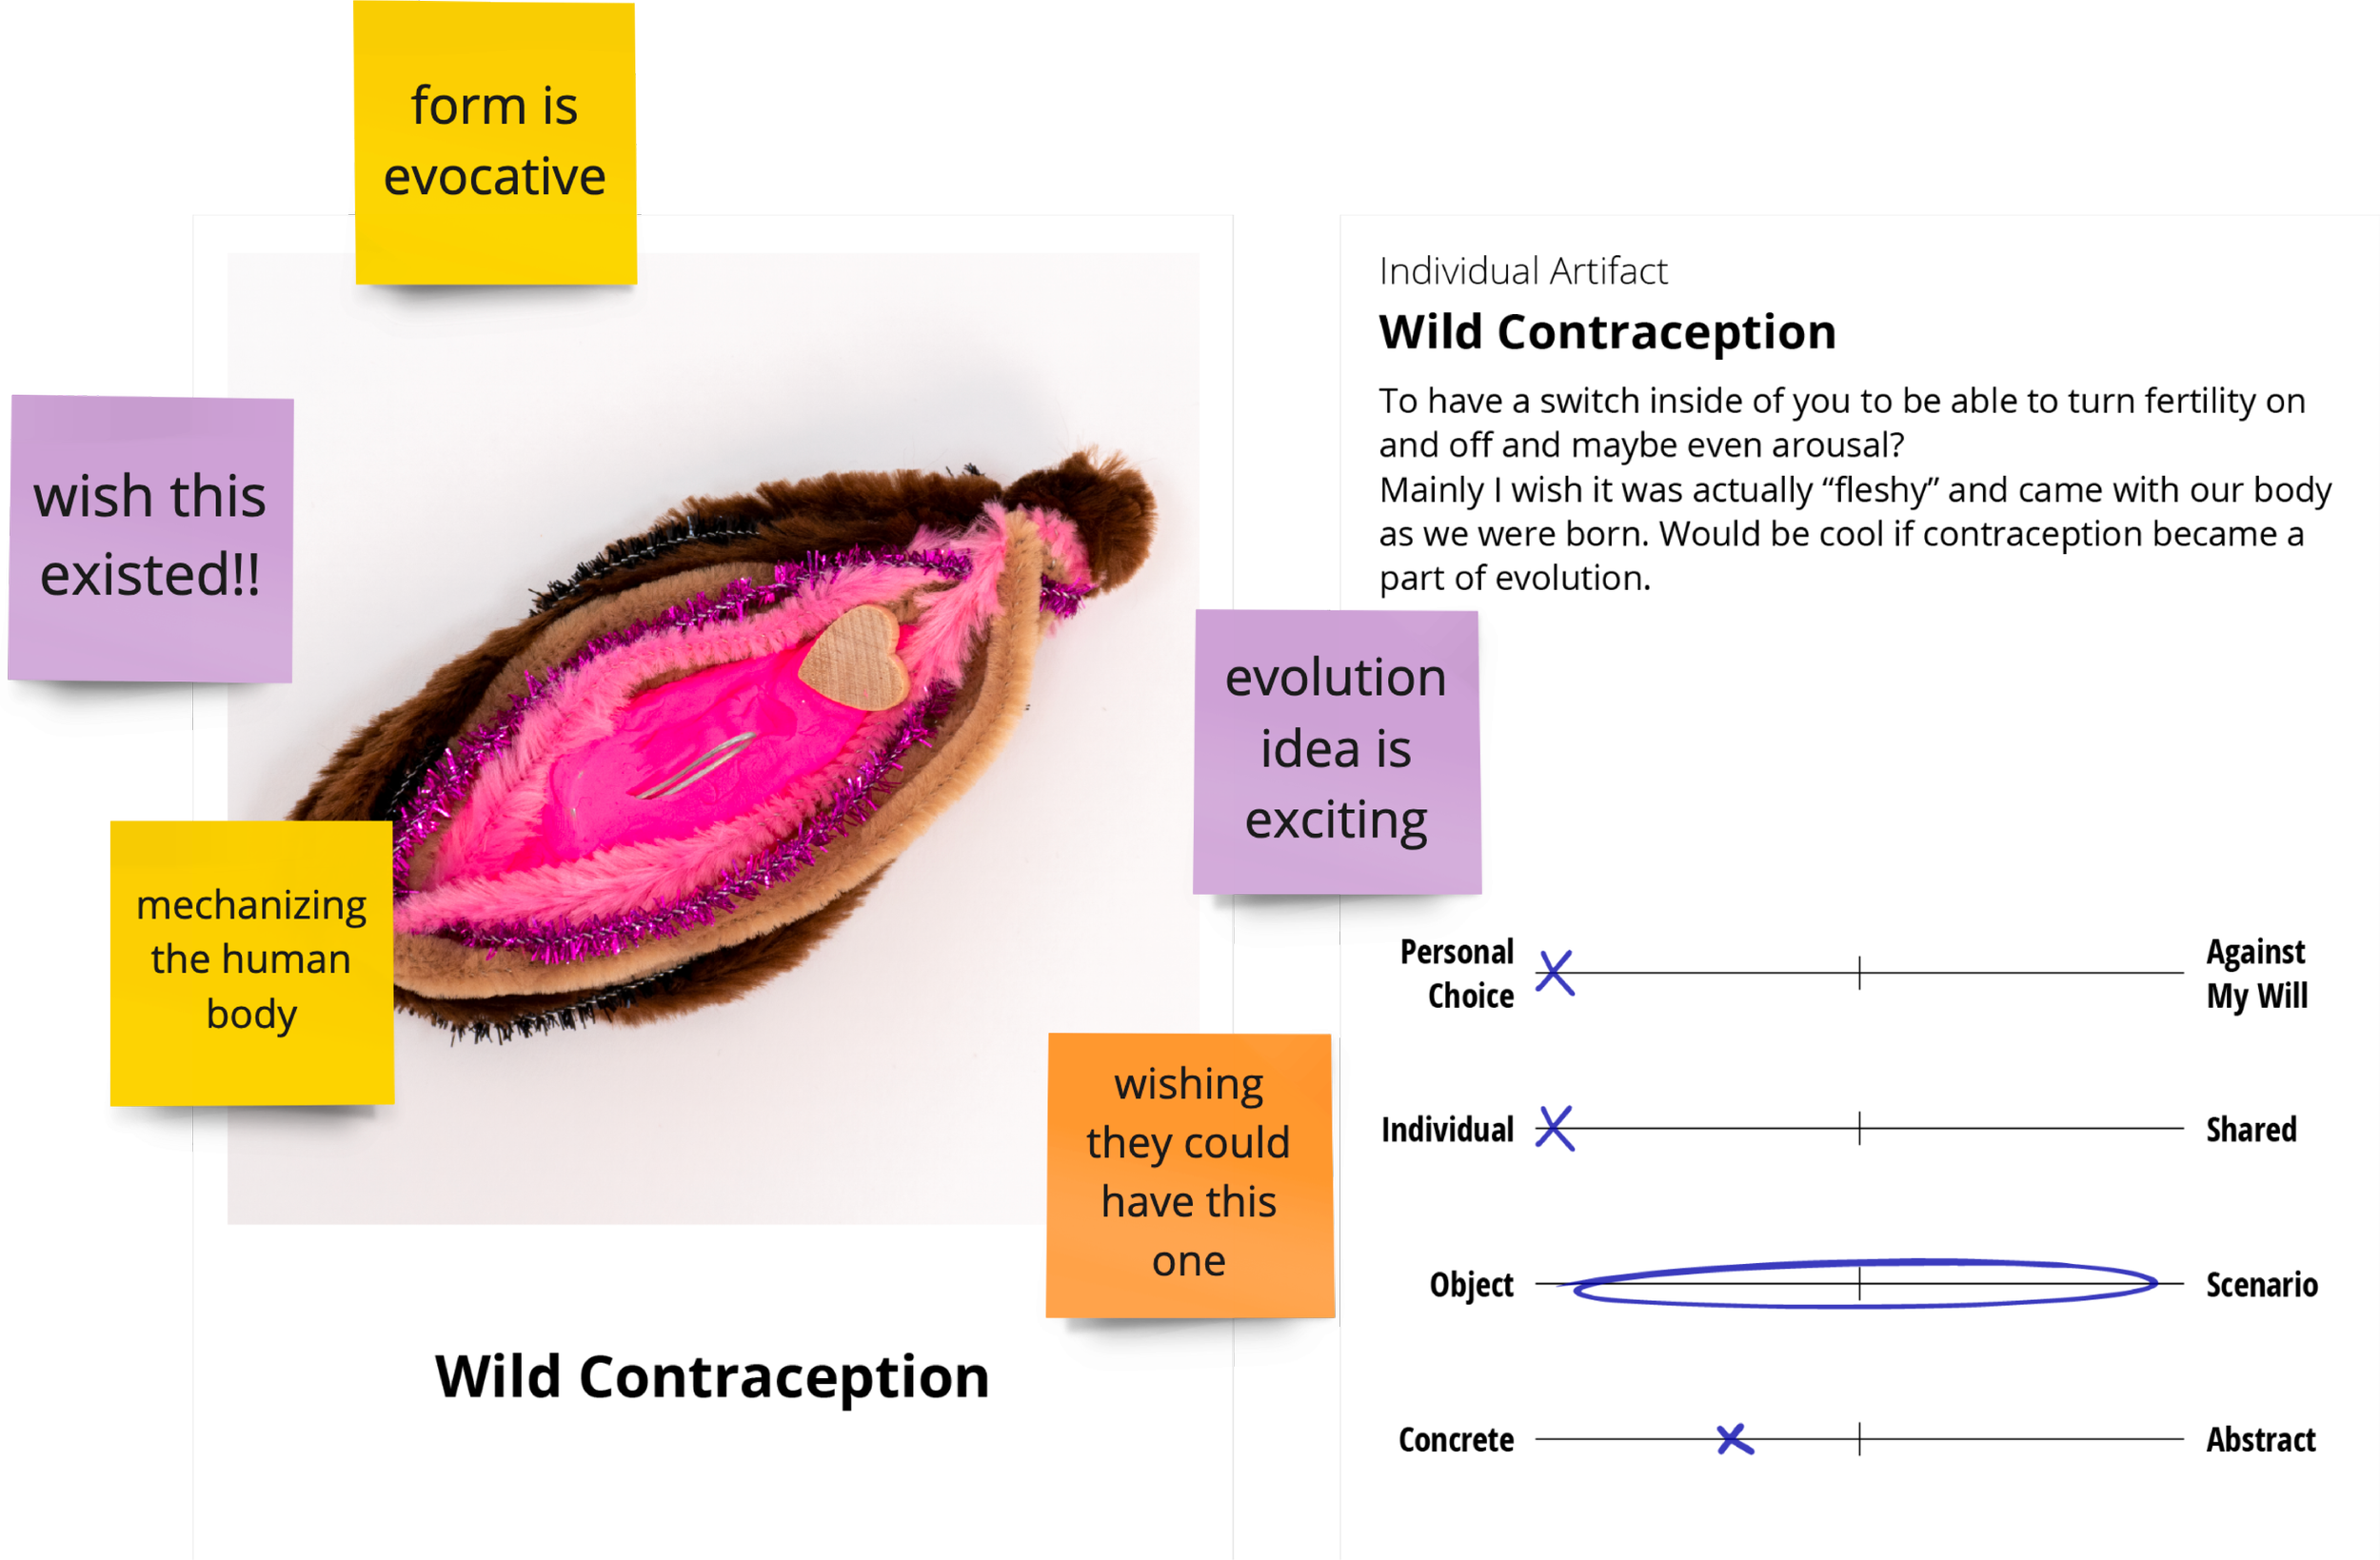
What artifacts did participants find the most evocative/provocative and why?
The futures cone (Joseph Voros, 2003-2017) was a concept I introduced in the sessions as a way to expand participants’ understanding of “futures” and way to collect data. Each participant was asked to place their individual artifact on the futures cone. This shows us where they see their idea fitting in with time and potentiality. I placed the group artifacts based on conversation during the sessions.

Almost all of the artifacts live in the “preferable” space.
The artifacts inhabit a wide range of time from near to far future.
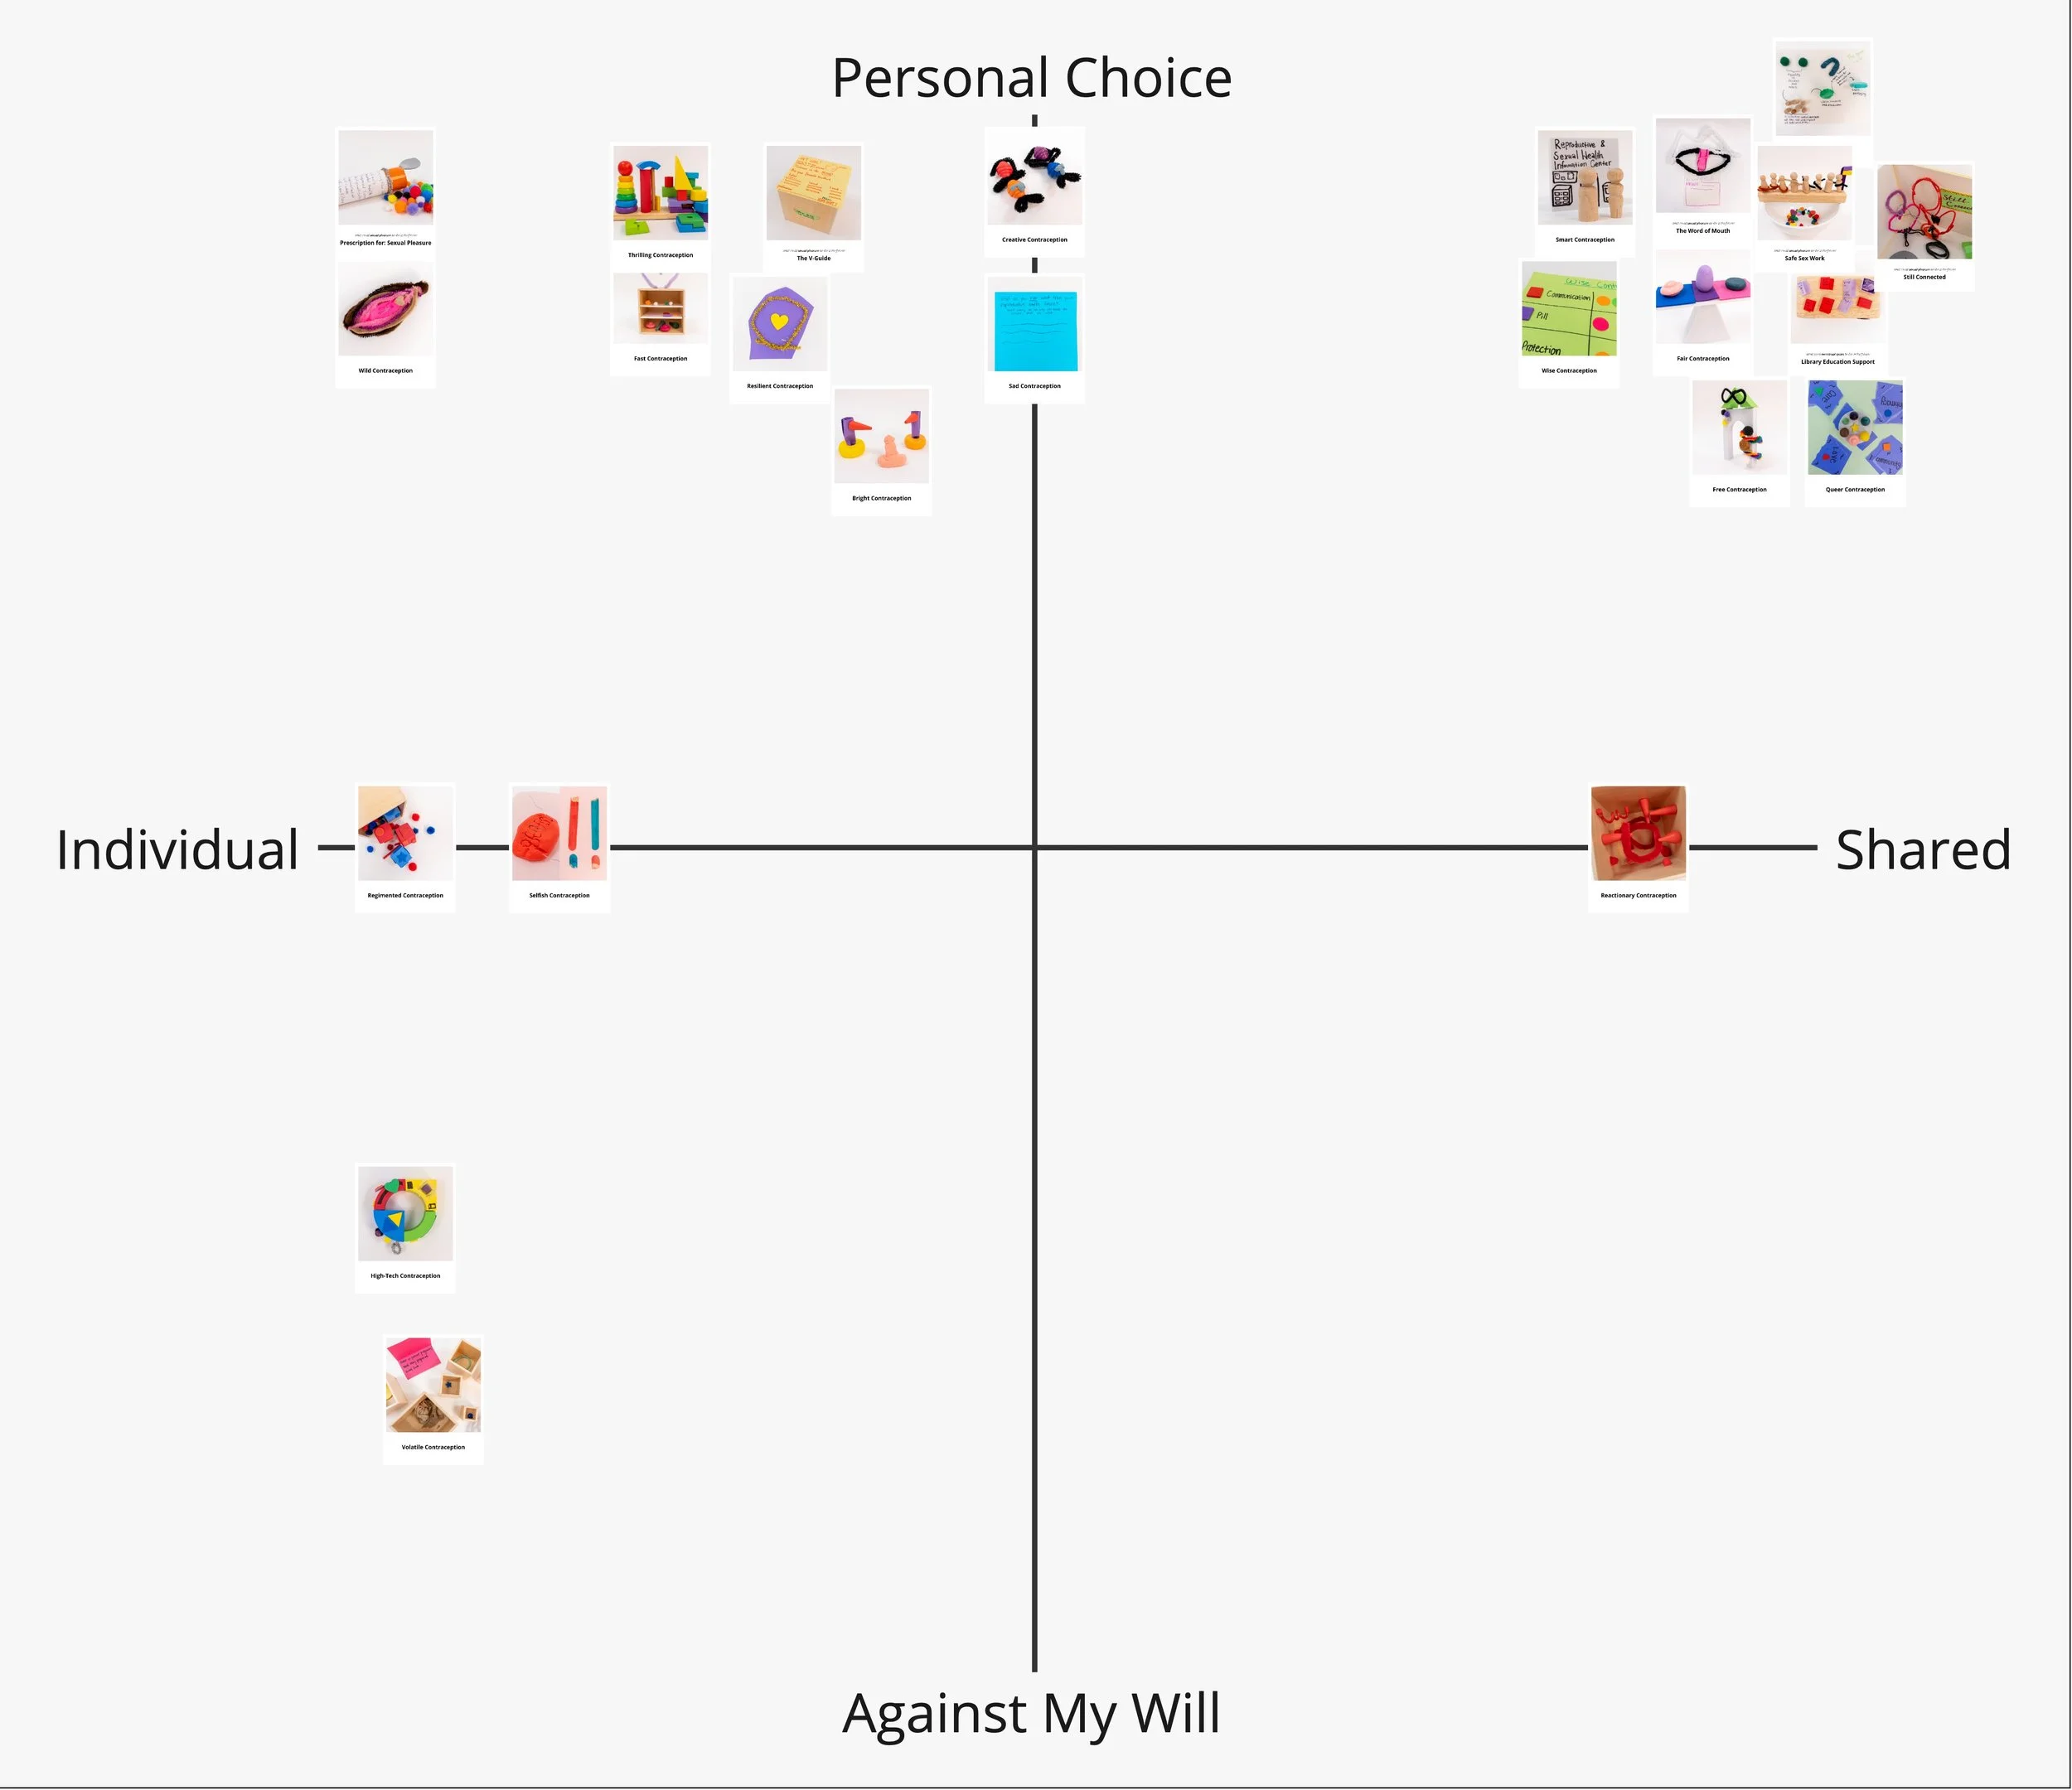
The matrices below were used as a way to make sense of the artifacts by looking for patterns in their stories.

The majority of artifacts are about having personal choice in sexual and reproductive experiences. This lines up with the positivity we saw in the Exploration Sheets!
Other insights came forward such as:
Artifacts that are about individual experiences (vs shared) were also concrete (vs abstract).
And it’s hard to make an abstract object…
There’s lots more to explore below!


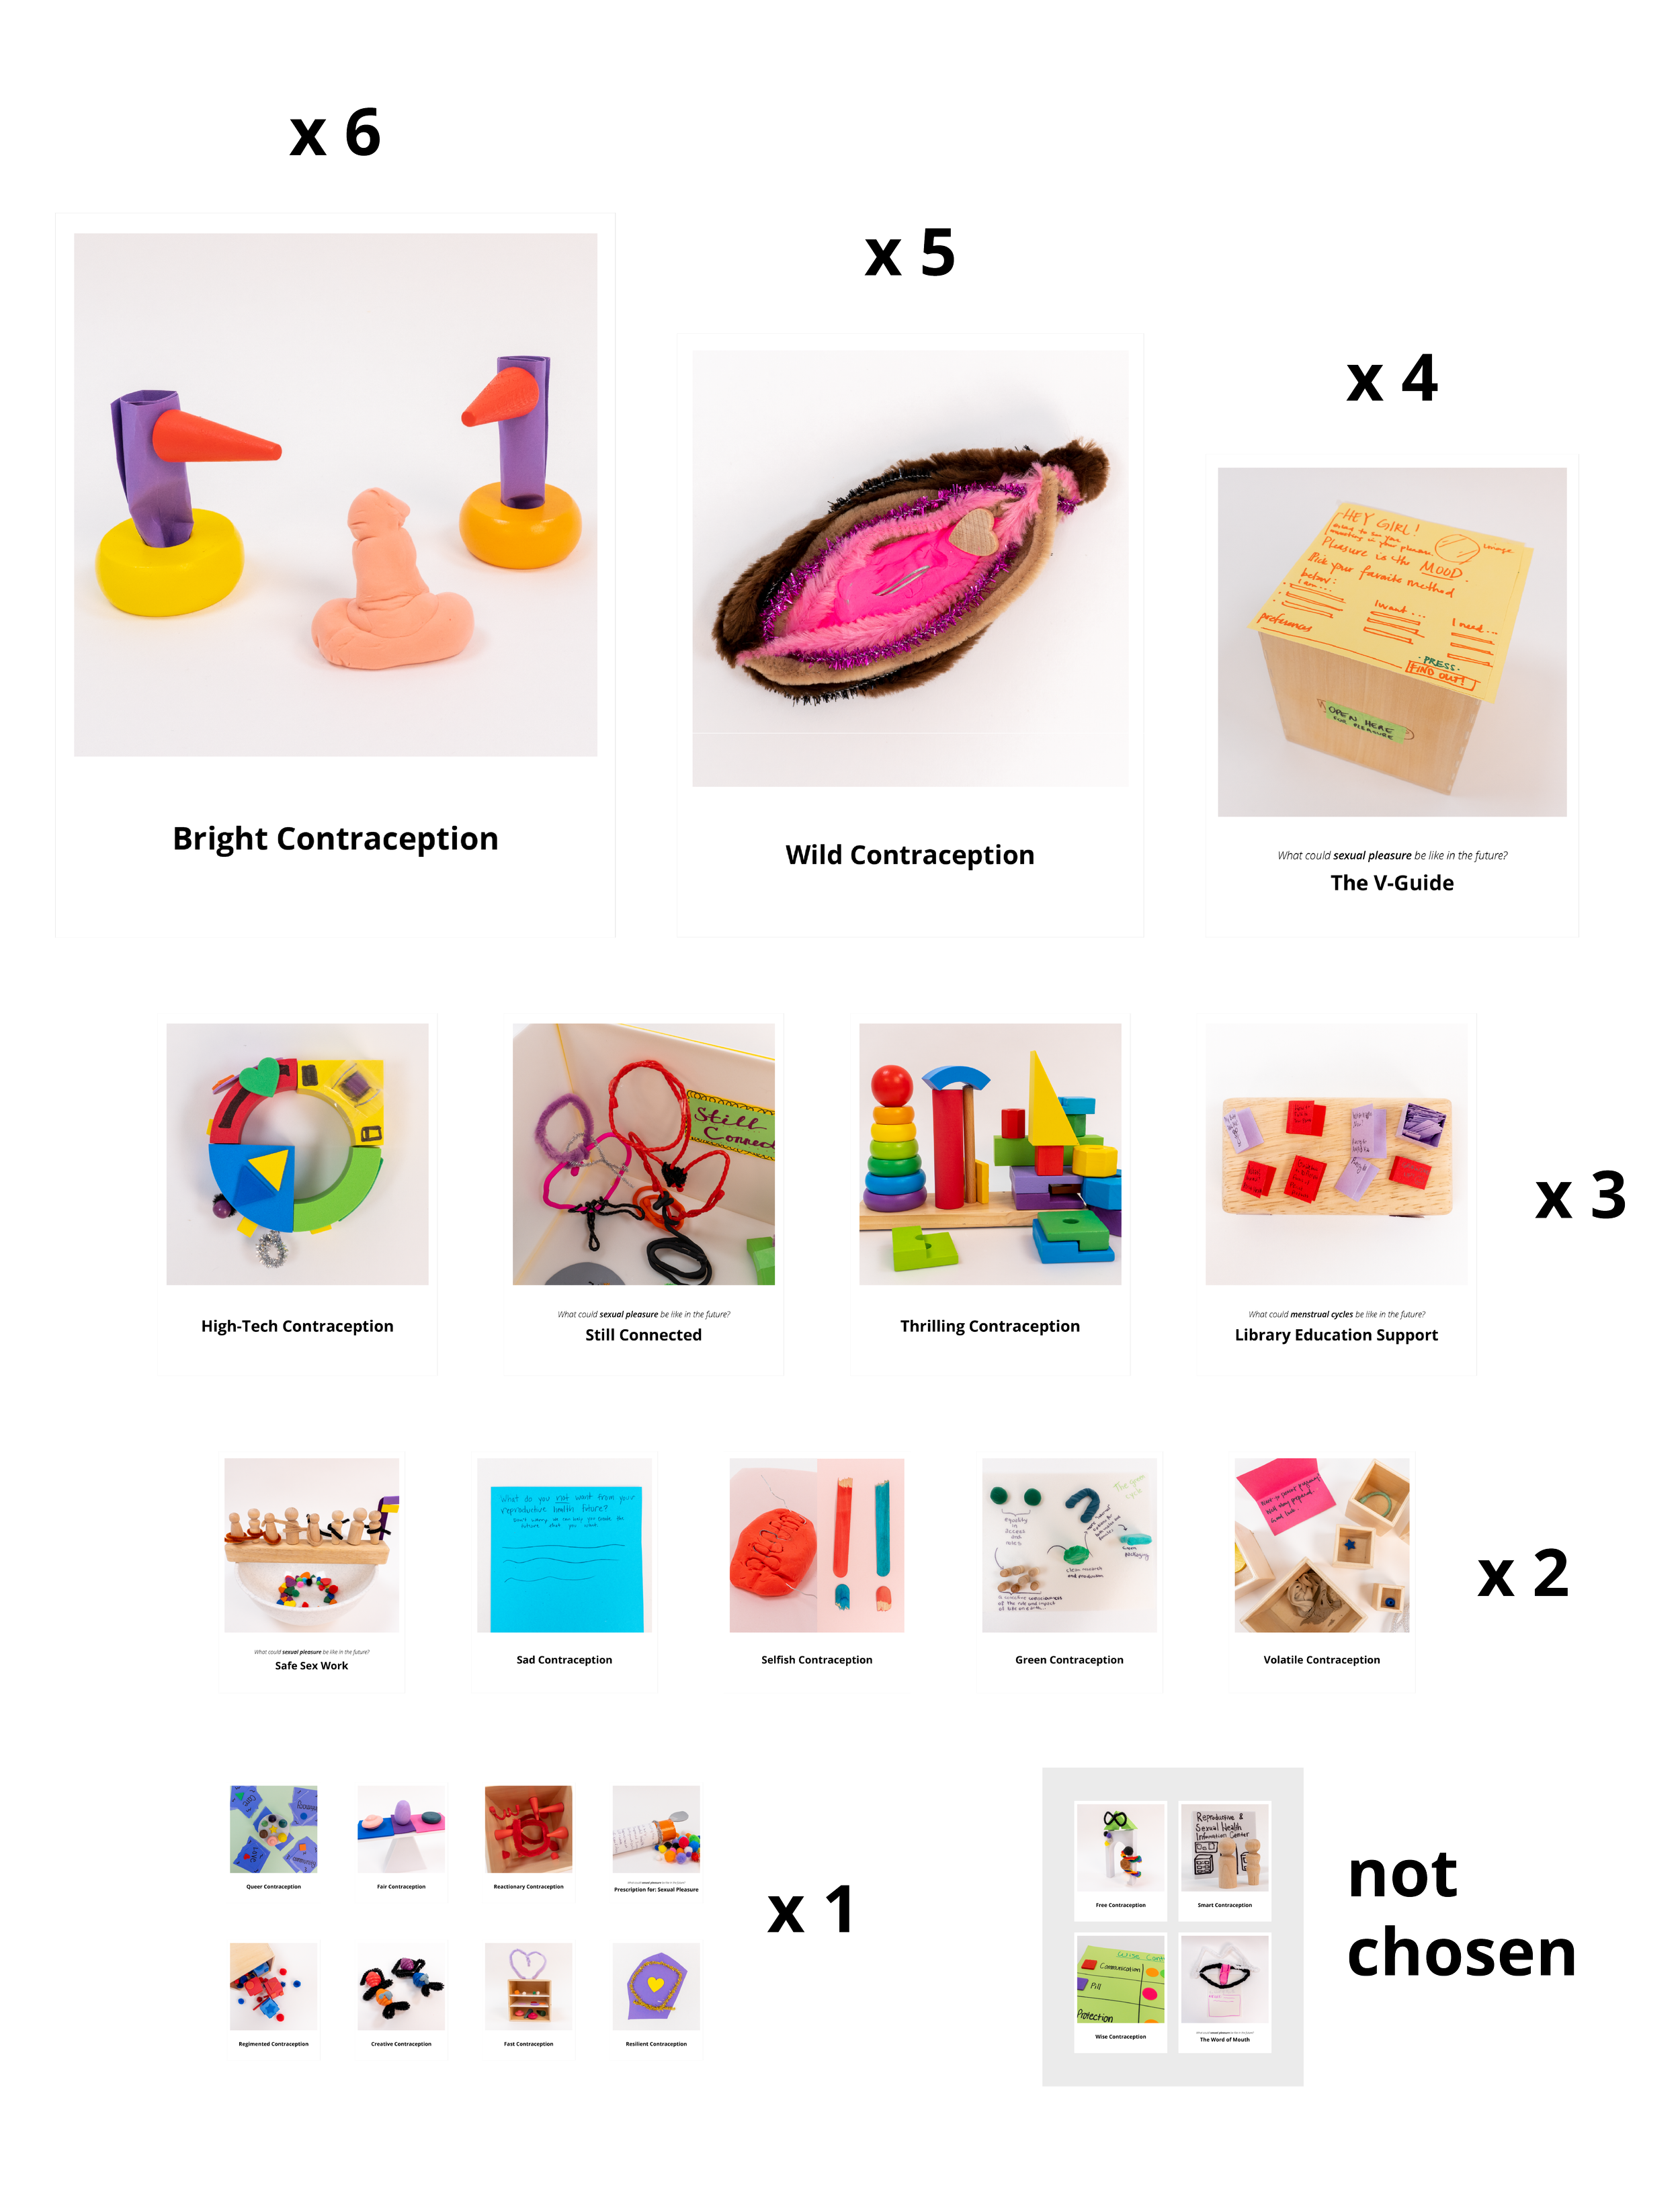
After making sense of what participants made, I wanted to explore why they thought what they made was meaningful. What makes an artifact provocative or evocative according to participants?
Through the audio recording, whenever a participant explained why they chose a particular artifact, I made a sticky note to capture their comment (plus some extra sticky notes when their choices sparked conversations among the group!)
The sticky notes went through a first round of clustering to see what stood out.

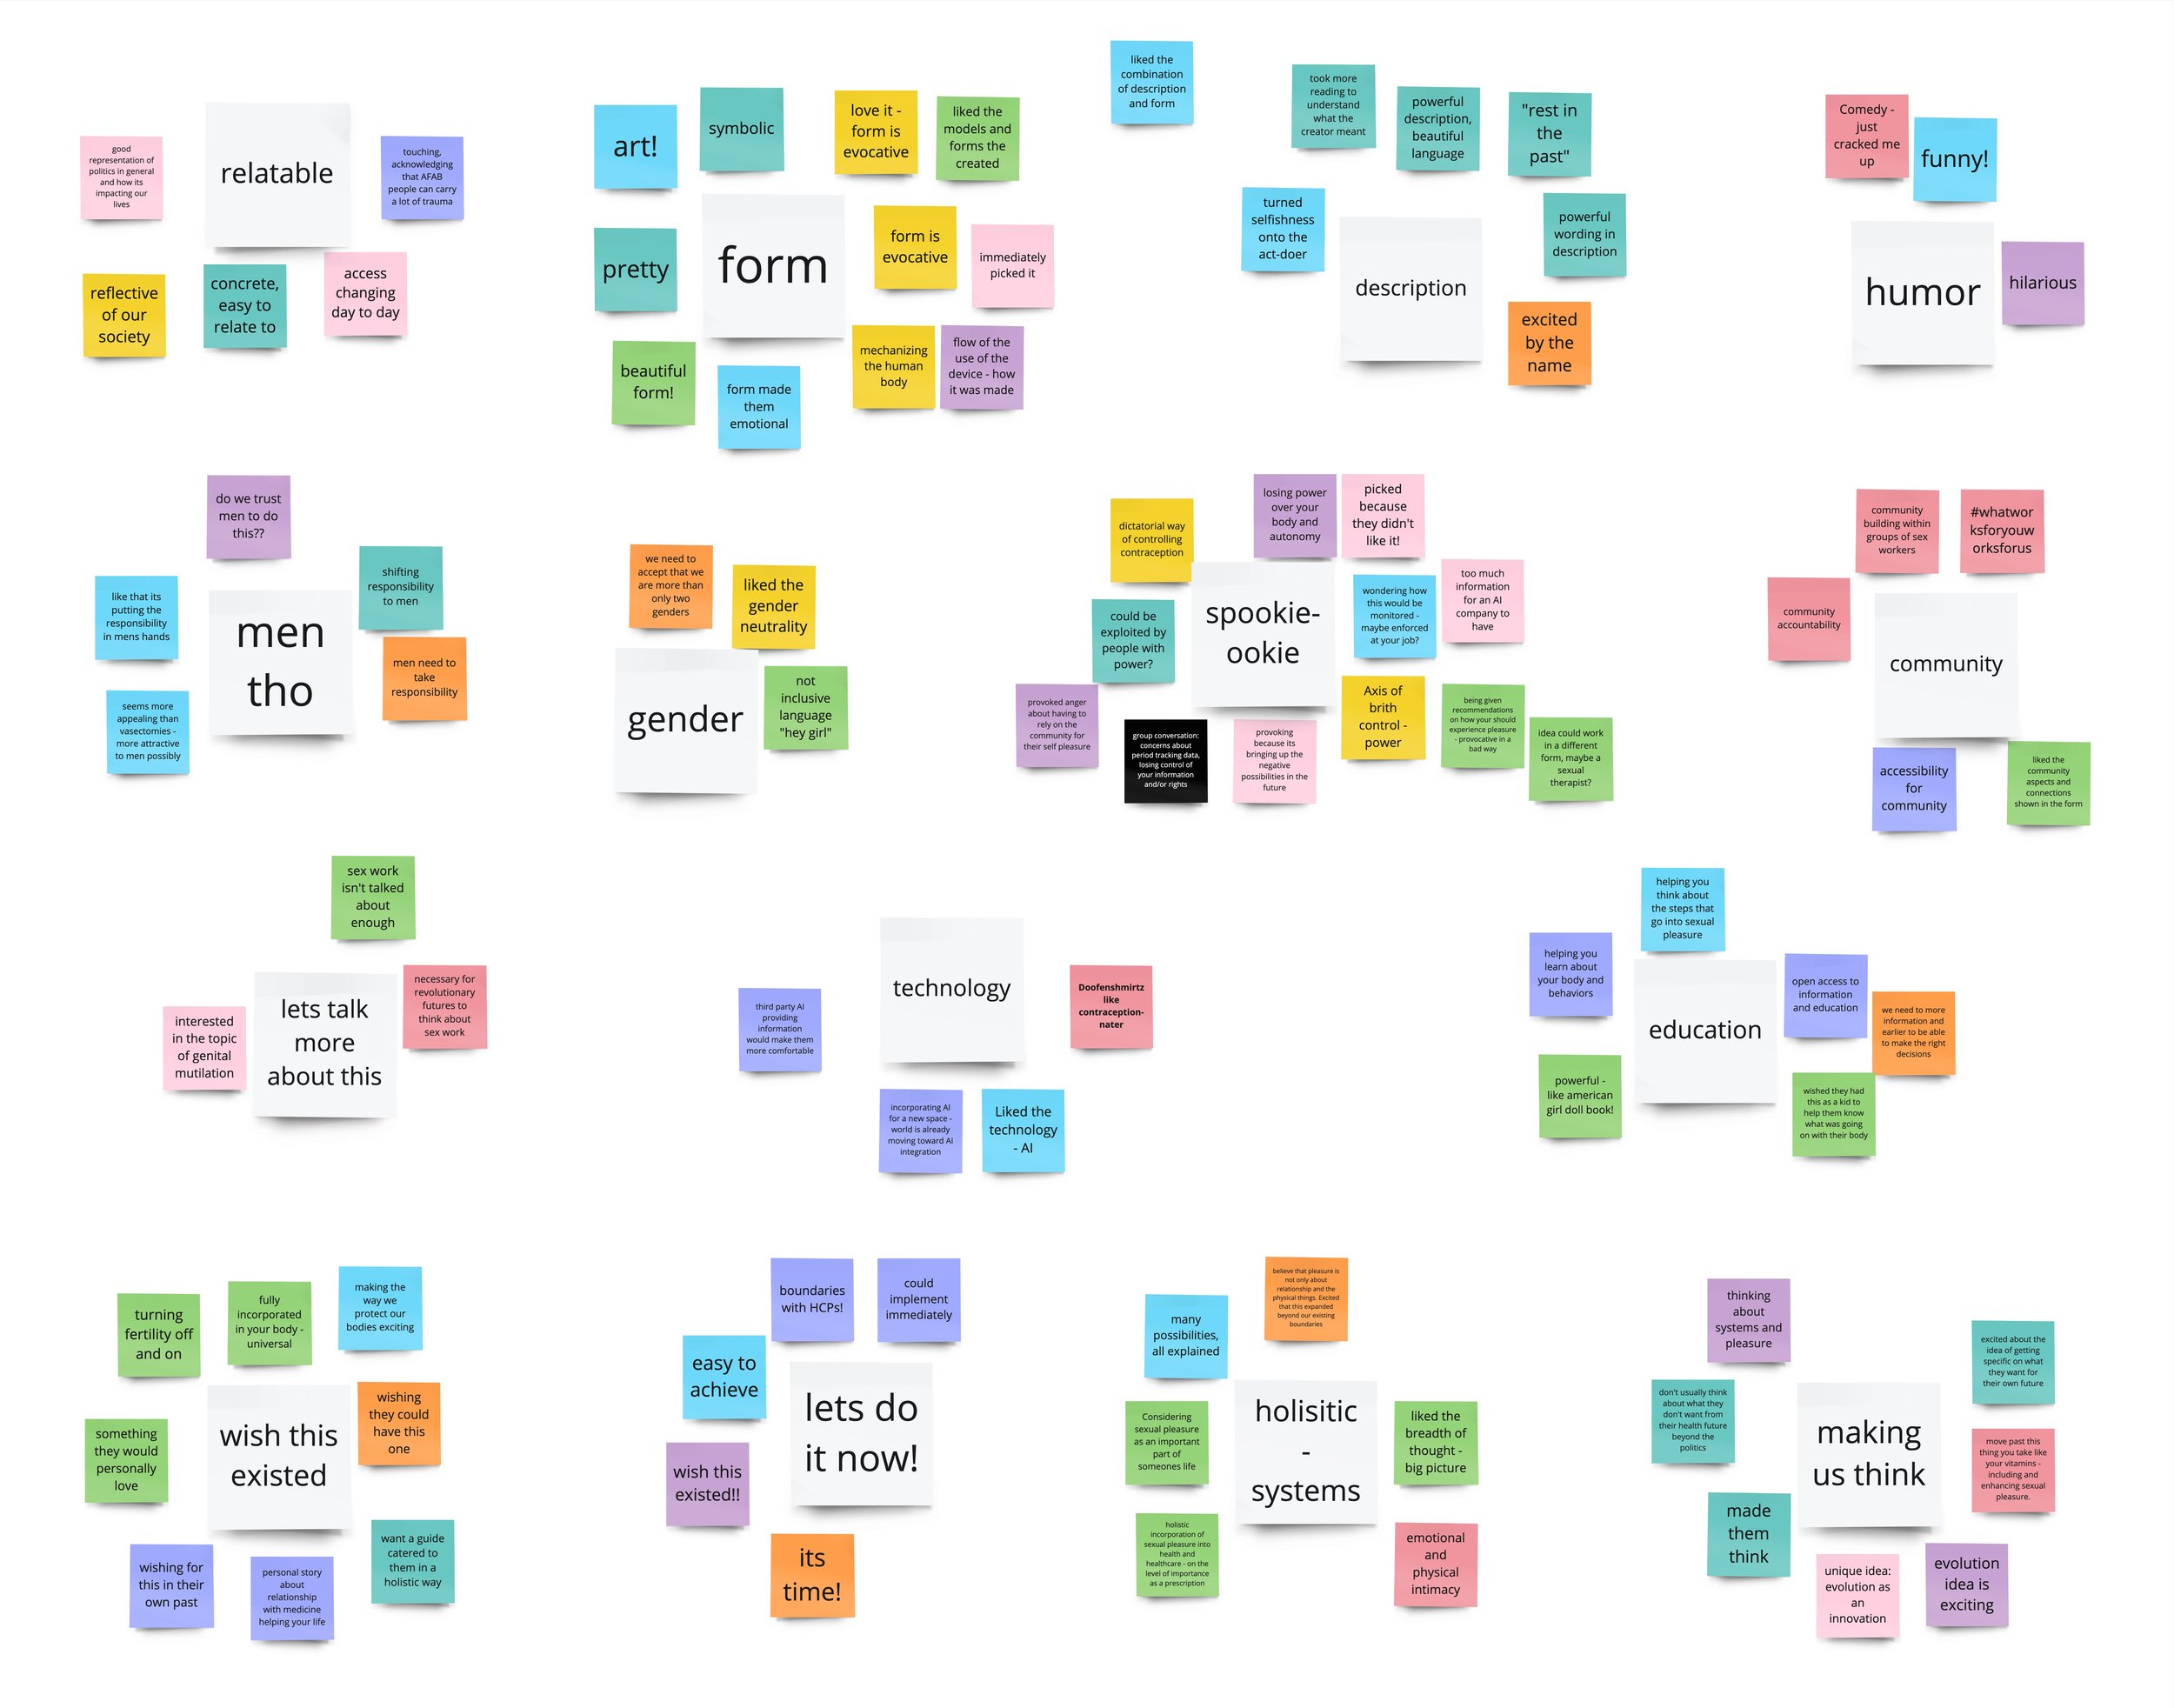
Afterwards, I organized the sticky notes into five overarching themes that captured the reasons behind participants' choices of artifacts.
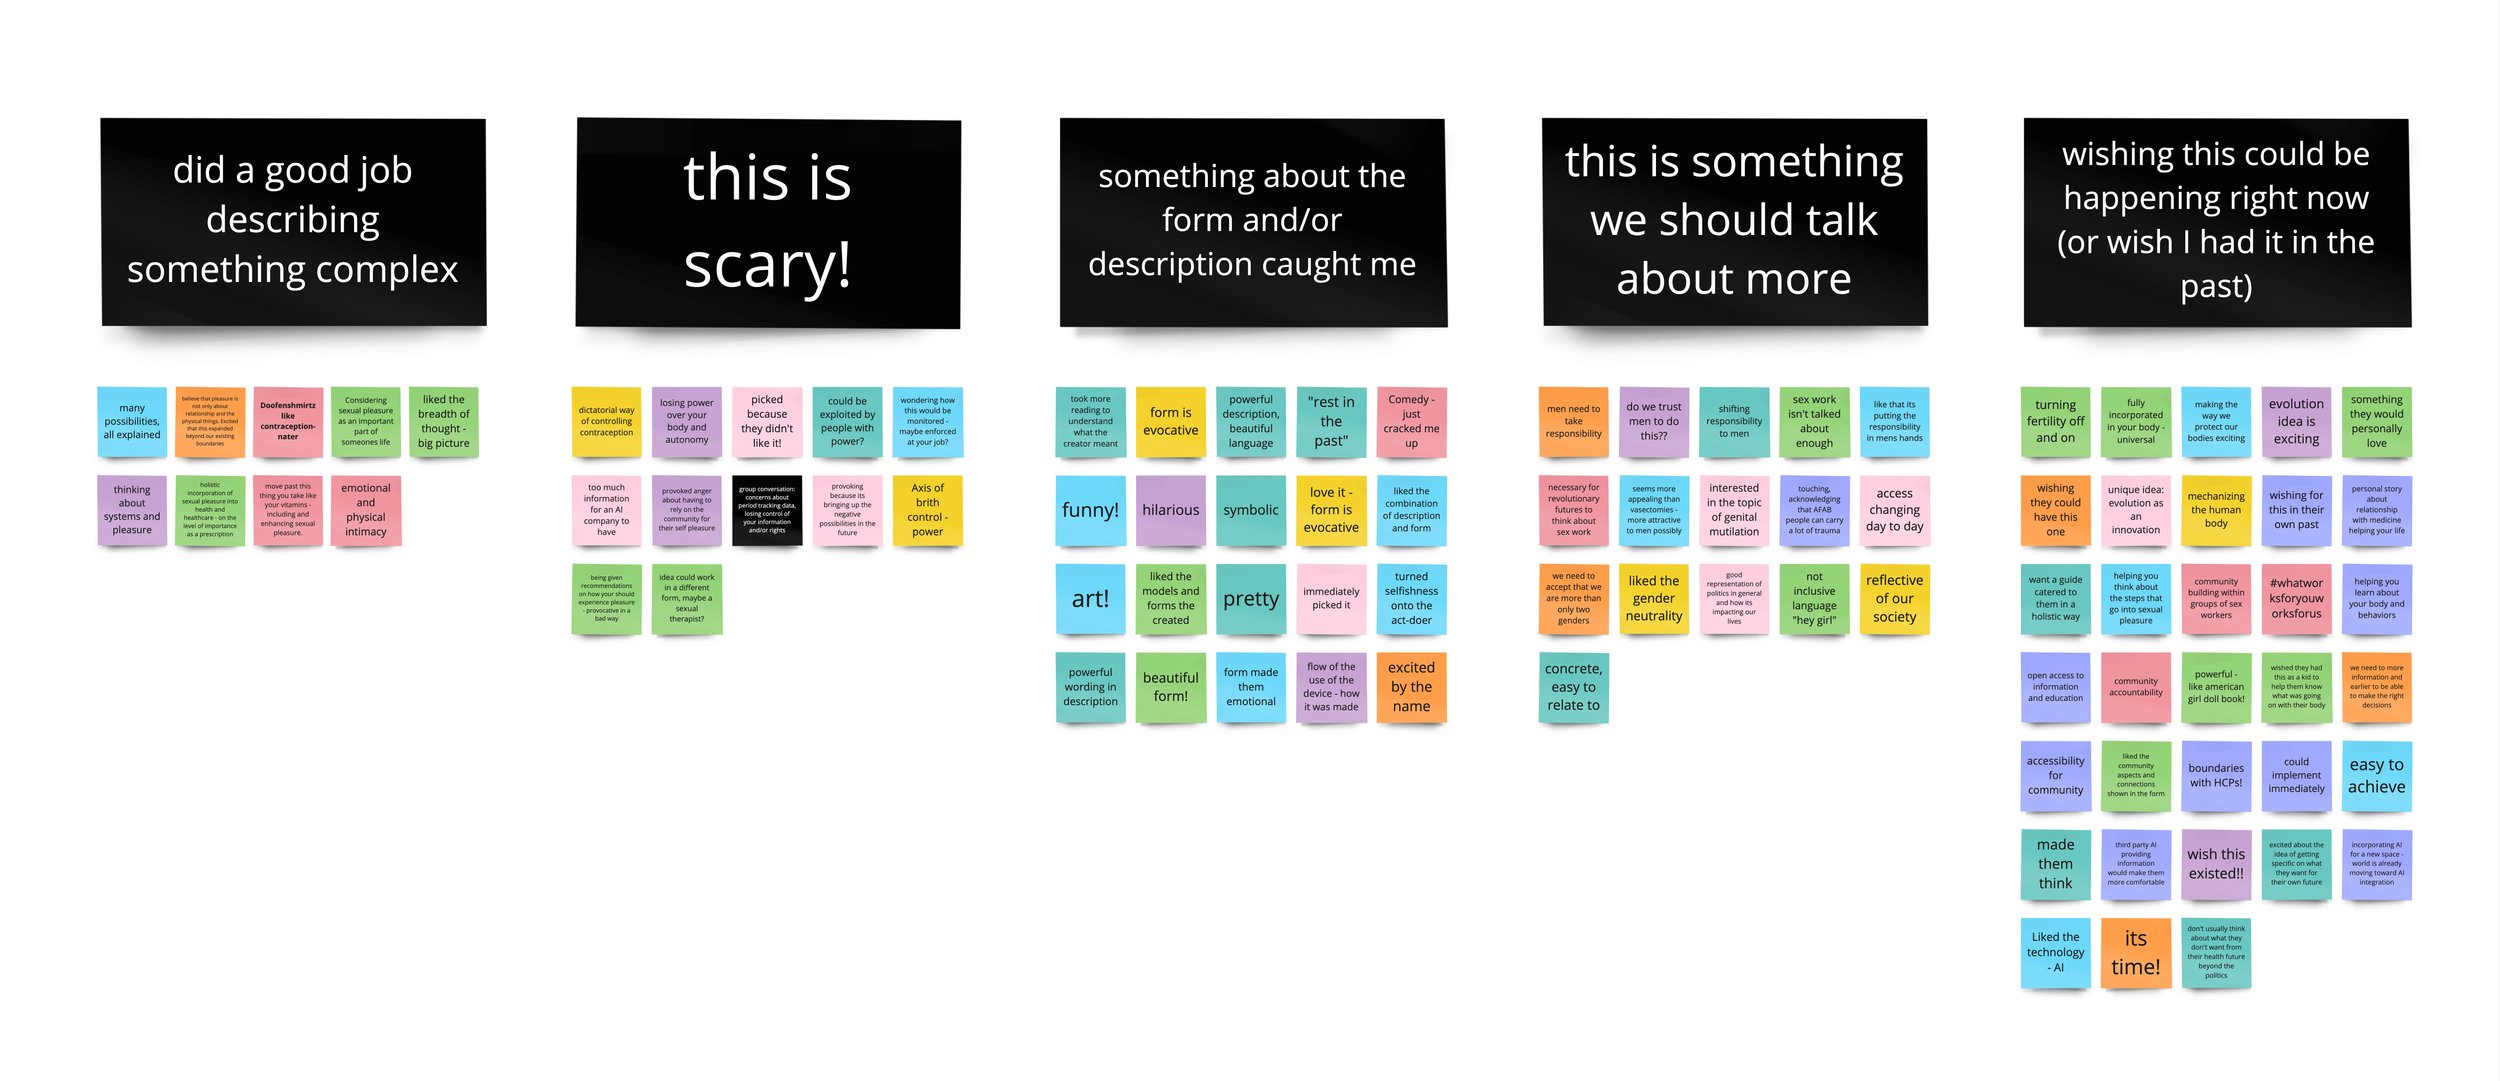
Artifacts felt provocative/evocative to participants if it was something they wanted right now, and something they could easily envision.
Collective Visioning
To make sense of the data from the Stage 2 sessions, I explored…What did both groups include in their overall experience timelines?
What what did both groups prioritize when envisioning how to share the artifacts?
How can this data guide the design of an artifact sharing experience?
Timeline Comparison
The two group timelines were compared to see the overlaps throughout. It was clear that participants wanted an exhibit to invite people to encounter the artifacts. They also wanted the exhibit to live both digitally (for most reach) and physically in Columbus, Oh (for most impact). The insights from the timelines made it clear how to go about designing the exhibit.
Prioritization Bullseye
The Prioritization Bullseye was summarized to see the most important images and words the groups chose. The participants placed the highest priority words, images, and stickers in the middle of the bullseye, with each concentric ring being of lesser importance. The items placed outside the bullseye were things the group did not want as part of the experience.


In the circle chosen by both groups we can see they wanted to invite all types of people to experience the radical futures they created; to ask new questions, spark conversations, and be surprised!
The iceberg image symbolizes the depth and complexity of the topic.The groups acknowledged that this exhibit wouldn’t be a fix, but could be a start.
Participants chose the image of multicolored eggs because they found them precious, unique, and something that could be held or interacted with. This aligns with their desire for an interactive component in the exhibit—a tangible item that visitors would receive upon entering and could take with them when they leave.

Participants envisioned a welcoming, interactive exhibit to share their artifacts. It was important that the exhibit was digital and physical.
Almost all of ideas written on the worksheets were positive.
Participants wanted to imagine preferable futures.
5 out of 6 groups chose Sexual Pleasure as their topic!
The groups seemed to want a fun, positive topic, avoiding more serious or upsetting topics like Abortion and Fertility.
Almost all of the artifacts live in the “preferable” space.
The artifacts inhabit a wide range of time from near to far future.
Artifacts felt provocative/evocative to participants if it was something they wanted right now, and something they could easily envision.
Participants envisioned a welcoming, interactive exhibit to share their artifacts. It was important that the exhibit was digital and physical.
The majority of artifacts are about having personal choice in sexual and reproductive experiences. This lines up with the positivity we saw in the Exploration Sheets!


